System Overview
Getting Started
Signing In to CaliberMind
New to CaliberMind - Start Here!
How to use Dashboards
How do I use CaliberMind's search functionality?
CaliberMind Home Page & Navigation
Digital Marketing Terminology
How Does CaliberMind Define a "Channel"?
What Is a CaliberMind Event or Event Table?
Account Detail (Search Result) Results
Opportunity Search Results
Campaign Detail Search Results
Person Detail Search Result
Connectors / Integrations
Adding Your First Connector
How To Connect AdRoll / RollWorks
How To Connect Google Analytics
How To Connect HubSpot
How To Connect LinkedIn Ads
How To Connect Marketo
Kickfire
Overview of Connectors
ZoomInfo / DiscoverOrg
CaliberMind IP Addresses for Whitelisting
Setting Up the LinkedIn Push Connector
Connecting Tableau to CaliberMind
CaliberMind Data Export to Google Cloud Storage
Ingesting CaliberMind Data Into Snowflake
Klaviyo connector [Via Fivetran]
In-App Notifications
Google Sheets
Segment Connector [via FiveTran]
Pushing Caliber Mind Person Engagement Data to Salesforce
Integrations Appendix by Connector
Act-On
SFTP Connector - Updated 2021
Connecting Your Data Warehouse to CaliberMind
Replicating CaliberMind Attribution Data to Salesforce
Salesforce Connector [via FiveTran]
Connector Health and Web Tracker Health reports
How to Connect Facebook Ads
KickFire De-Anonymization in CaliberMind
Connecting G2, Bombora, or 6sense
CaliberMind Connectors
Field History SFDC Limits (Salesforce)
SFTP Synced Files - Making a Data Change
How To Connect Outreach
CaliberMind Connectors - Start Here!
Power BI/ Tableau/ Looker Connectors Article
Google Ads Connector (via FiveTran)
Pardot Connector [via FiveTran]
Connections - Email Notifications
CaliberMind Data Access FAQs
Twitter API Connector via Fivetran
Microsoft Bing Connector
Setting Up the Salesforce Push Connector
How To Connect Microsoft Dynamics
Bing/Microsoft Ad's Connector
Connectors Status Page
Developer Guide
CaliberMind Entity Relations and System Tables
Developer Guide - Start Here!
What is Google BigQuery
CaliberMind Common Data Sources
CaliberMind Identity Levels
System Configuration
Object Mapping Filters
How to Map Your Salesforce Opportunity Revenue Field
Custom SQL Data Transformations
Remove a BigQuery User within CaliberMind
Object Manager: Campaign Member
Setting Your Saved Filters for In-App Reporting
Object Mapping: Create a Filter
Object Mapping: Create a Mapping
Adding Custom Columns in Salesforce
Add BigQuery Users within CaliberMind
Custom Configuration for Object Mapping
Object Mapping: Create a Replacement
How to Email CaliberMind Reports
Setting Up UTM Mapping in CaliberMind
Standard Channel Logic
Channel Ranking Logic
Setting Up Account Trend Emails
UTM Parameters Formatting and Best Practices
Object Mapping for Filters - Start Here!
How to See Your Object Manager History and Revert Back to Previous Versions
Object Mapping: Create a Campaign Substitution
List Builder
What are Lists?
Importing a List
Account List Upload File Requirements
Keyboard Shortcuts using SQL
Creating an Account List From a Campaign
How to create a list of all Opportunities that have a very low Engagement
People List Upload File Requirements
Campaign List Upload File Requirements
Use Case Videos - Creating a List Using the List Builder
Creating a List Using the List Builder - Step-by-Step Instructions
Creating Company Lists using SQL
List Builder - Start Here!
Creating Company Lists in List Builder
Where is my Segments Menu?
Downloading a List - Step-by-Step Instructions
Web Tracker Installation & Settings
Installing AnalyticsJS (CaliberMind snippet)
Two ways to identify prospects that submit a form containing email address using AnalyticsJS
Install AnalyticsJS on a HubSpot website
Using AnalyticsJS Identify on embedded Hubspot forms
Using AnalyticsJS Identify on embedded Marketo forms
Types of Analytics.js Calls
Analytics.JS Overview
Using Analytics.js to Track Web and Product Events
Web Tracker and Installation Settings - Start Here!
How Cookie Settings Affect the Analytics.JS Tracking Script
Google Tag Manager (GTM) Ad Blockers
Using AnalyticsJS with Drift
How to check your AnalyticsJS implementation
Using AnalyticsJS with Qualified
Flows
Flows Status Page
How to use QuickFlows
Merge records in Salesforce CRM
Add a Quick-Flow to Salesforce Campaign
Using ClearBit Flows
CaliberMind's Most Popular Flows | Automations
Setting Up Workflow - Lead Deduplication
ZoomInfo - Add-to/Enrich your database
Setting Up Workflow - Website Repair
Setting Up Workflow - Account Deduplication
Creating Sales Campaigns from Salesloft and Outreach Activities
Setting Up Workflow - Contact Deduplication
Campaigns
Campaign-Program Membership
Program Logic for Campaigns
Custom Campaigns
Custom Programs for Campaigns
Campaigns - Start Here!
Setting Up Answers
Setting Up Answers - Start Here!
Using CaliberMind Answers to Understand Funnel Impact
Using CaliberMind Answers to Understand Campaign Performance
Using CaliberMind Answers to Understand Funnel Performance
Using CaliberMind Answers to Understand Account Engagement
Using CaliberMind Answers to Understand Funnel Flow
User Administration & SSO
Single Sign On (SSO) Setup
Manage Users - Viewing, Inviting, Updating Users and Roles
CaliberMind Data Warehouse Access in Google BigQuery
Administration and SSO - Start Here!
User Authentication and Provisioning
Identify users using Intercom Messenger
GDPR Compliance with CaliberMind
Data Dictionary
Attribution
Analytics
Attribution
Removal effect with a Markov chain model
Attribution Reports Summary
Attribution - CaliberMind versus Embedded Attribution in Salesforce?
Analytics: People Tab in Attribution Overview
Analytics: Opps Tab in Attribution Overview
Virtual Campaigns in CaliberMind
Campaign Types - Best Practices for Easy-to-Read Attribution
Analytics: Comparisons Tab in Attribution Overview
Analytics: Events Tab in Attribution Overview
Analytics: Summary Tab in Attribution Overview
Analytics: Explore Tab in Attribution Overview
Demand Generation
Data Integrity
Customer Success
Understanding Reports
CaliberMind Analytics Concepts
Overview of Analytics and Attribution
Filters and Hyperlinks
Using the Engagement Trending Report
Using Tags to Organize Your Lists
Attribution Overview - Campaign Performance Table
Using Campaign Lists in Dashboards
Using Account Lists in Dashboards
CaliberMind Metrics Definition
Product Attribution Dashboard
Attribution Models: First-Touch
Self-Hosting CaliberMind AnalyticsJS
ROI
Revolutionizing Marketing ROI: CaliberMind's Innovative New Approach
Return On Ad Spend Dashboards
Revenue Contribution Reports Summary
Channel ROI Overview
Creating and maintaining a custom advertising budget for ROAS
Best Practices for Tracking Return-on-Ad-Spend (ROAS)
Why Is CaliberMind ROAS or ROI Different Than My Ad Platform?
Campaign ROI Overview
Budget for ROI Channel Reporting
Attribution Models
Funnels
In-App Funnels
CaliberMind Insights
Working in CaliberMind Insights
CaliberMind Insights - Browser Requirements
CaliberMind Insights - Sharing Dashboards & User Permissions
CaliberMind Insights - Navigating to Insights/Dashboard
CaliberMind Insights - Using Dashboards
CaliberMind Insights - Dashboard Refresh Schedule
CaliberMind Insights - Application Concepts and Terminology
CaliberMind Insights - Filters & Aggregation Type
Creating a Custom Pipeline Dashboard (VIDEO)
CaliberMind Insights - Creating Custom Dashboards
How to Create a Filter Bookmark
Building Insights Dashboards
Build Your Own Insights Pipeline Dashboard
Building Formulas with Functions
Creating and Editing a Widget Formula
Using Conditional Statements
Build Insights Dashboards - Start Here!
Create Date Range Filters - Step-by-Step
Creating Formulas Based on Criteria and Conditions (Filters)
Calculated Fields
Dashboard Function Reference
Shared Formulas
Introduction to Formulas - Start Here!
Using Quick Functions
Insights Dashboards
Insights Attribution Dashboards
Insights - Attribution - Start Here!
Insights - Attribution Terminology and Key Concepts
Insights - Attribution Overview Dashboard 2.0
Insights ROAS Dashboard
Insights - ROAS Dashboard Use Cases
How is CaliberMind ROAS Reporting Different than Insights ROI?
Insights - ROI - Start Here!
Insights - ROAS Terminology & Key Concepts
Insights Engagement Dashboard
Insights - Engagement - Start Here!
Insights - Engagement - Dashboard Terminology & Key Concepts
Insights - Engagement Overview
Insights - Engagement - System Account Detail
Insights - Engagement - Person Detail
Insights Engagement Dashboard - Aggregation Dates
Insights Data Health and Integrity
Funnel Trigger Events Dashboard
Funnel Company Inclusion Configuration
What is a Marketing Funnel?
Event Explore for Funnels
Funnel Terms and Concepts
Common Funnel Issues
Funnels FAQs Technical Documentation
Funnel Configuration
Funnel History Event Configuration
Funnels - Start Here!
What channels move journeys through a given stage?
Funnel Stages Configuration and Stage Definitions
Funnel Trend Dashboard
How can I see the number of journeys in or passing through a funnel stage during a period of time?
Sales Funnel Metrics
What touches are influencing each step in the funnel?
How do I see the first event (or "tipping point") in each stage of my funnel?
Funnel Events Technical Documentation
Marketing & Sales Funnel Foundations
Funnel Static Event Configuration
What is a Starter Funnel?
Funnel Person Inclusion Configuration
Funnel Cohort Analysis Dashboard
Sales Funnel Glossary
Where are my customers stuck in journeys?
Funnel Cohort Analysis Use Cases
Funnel Data Explore Dashboard
Use Cases for Funnels
Sales Funnel Journey Questions and Answers?
What is the difference between an Active Journey and a Journey?
How do I know the last event that happened before a journey stage change?
How do I identify stage conversion rates?
Funnel Person Status Exits
Introducing CaliberMind's Funnels
Funnels - Lead, Contact, Account, Opportunity Statuses and Stages
Pressure Event Dashboard 101
Funnel Stage Definitions
Demand Generation Funnel Dashboard
Engagement and ABM
Engagement Scoring
Model Configuration
Insights - Create Multiple Engagement Score Models
How to Change Event Touch Scores
Sales Opportunity Data Model
Engagement Scoring Time Decay - How It Works & How to Change It
Engagement Scoring Models Overview
Custom Attribution Configuration - Custom Weighting
How to Add or Change Engagement Score Multipliers
Add or Change Engagement Score Filters
Using Engagement Score to Trigger an Update in Salesforce
Which touches and events are we scoring?
Customize Engagement Scoring Models - Start Here!
Default ABM Scoring Logic
Engagement Reporting
Account-Based Marketing Reports
Engagement: Summary Tab
Engagement Overview: Companies Tab
Engagement Overview: People Tab
Engagement Overview: Campaigns Tab
Engagement Overview: Explore Tab
Linking to CaliberMind Reports in Salesforce
ABM Best Practices
Tutorials and Use Cases
Customizing Report Visibility (Show/Hide)
How to Manage Your Offsite Events Using CaliberMind
How can I manage my BDR/SDR team activities with CaliberMind?
Combining Engagement Score with Attribution
Enabling the Sales Teams to see the Entire Buyers Journey
How Can I Identify High Risk Opportunities?
How does Sales leverage CaliberMind? Some key use cases.
Running a Sales/Pipeline Review with CaliberMind
How Is CaliberMind Different From My CRM Attribution?
CRM Campaign Member Status and Campaign Response Best Practices
How Do I Optimize Advertising Spend?
Campaign Best Practices Across Systems
How do I use CaliberMind to shorten our sales cycle?
Answering Business Questions Using CaliberMind Reports
Which of my leads are the most engaged?
How Do I Know If a Campaign Is Good or Bad?
How to Flatten Your Campaign Structure in Salesforce
Table of Contents
- All Categories
- Funnels
- Funnel Trend Dashboard
Funnel Trend Dashboard
CaliberMind Funnel Trend Dashboard
The Funnel Trend Dashboard - Purpose
The Funnel Trend dashboard is cohorted by the date the funnel stage occurred. A funnel trend dashboard analyzes and reports stage behavior over a defined period of time. The conversion rate is tracked over time and frequency. Based on observable factors, funnel trend analysis compares previous time frames, stages, and forecasts future cohort movements.
What is a Cohort?
Is a Cohort the same as demographics?
What is Cohort Analysis?
Why use cohort analysis?
The Funnel Trend Dashboard - Assumptions
The Funnel Trend dashboard assumes the following:
Your business is using the following standard CRM objects
Campaign
Campaign Manager
Lead
Contact
Account
Marketing automation platform integration
You have cohort identifiers within your system
Establihed time of lifecycle stages
Funnel Trend Dashboard - Description
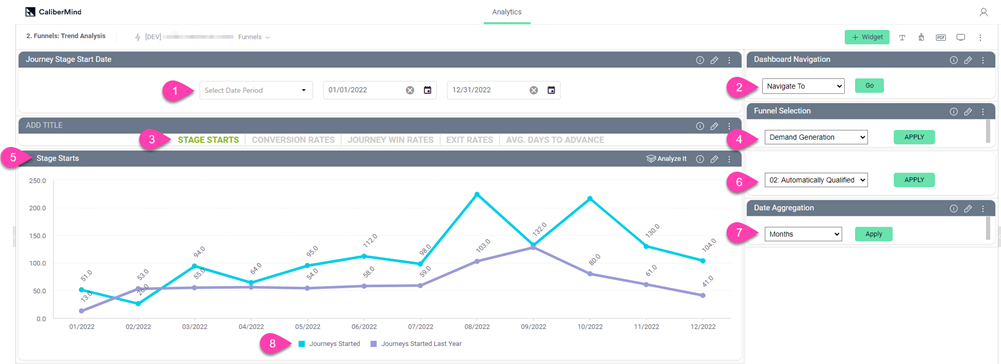
Date Range Picker - Select date ranges interactively
Navigation Dropdown List - Navigate to other dashboards quickly via the dropdown list
Trend Metrics Selection Button - Interactive buttons of all available metric options
Funnel Selection Drop-down list - Select the desired funnel
Interactive Line graph - Visualization of the cohorts behavior over time
Funnel Stage Drop-down list - Interactive drop-down list of all available stage options
Date Aggregation - Drop-down list of date ranges: Quarter, month, week, day aggregation buttons
Interactive graph key - Identifies comparisons plotted on the graph
Funnel Trend Dashboard - Use Case Scenario and Analysis
The following use cases have been developed based on the perspective of the user type. An explanation of the type of information is provided, as well as a dashboard from where you can easily obtain that information.
Who Would Use the Funnel Dashboard?
Role: Sales Executives, Marketing Executives, Marketing Directors, Marketing Tacticians, and Operations
Funnel Trend Use Case Scenario
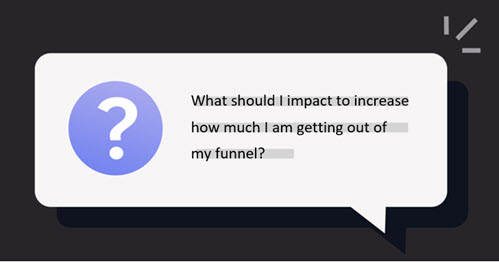
Q: What should I change to increase how much I am getting out of my funnel?
A: We need to consider the 3 keys to predictability - figuring out how much volume you need to convert into the next stage and how long it will take to move to that stage.
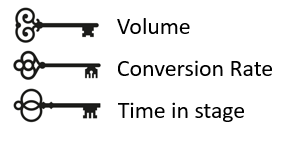
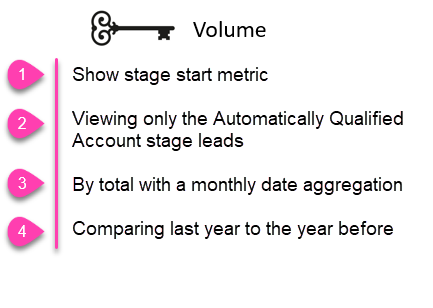
- Volume - I want to see the total number of qualified accounts month over month and how it's trending year over year?
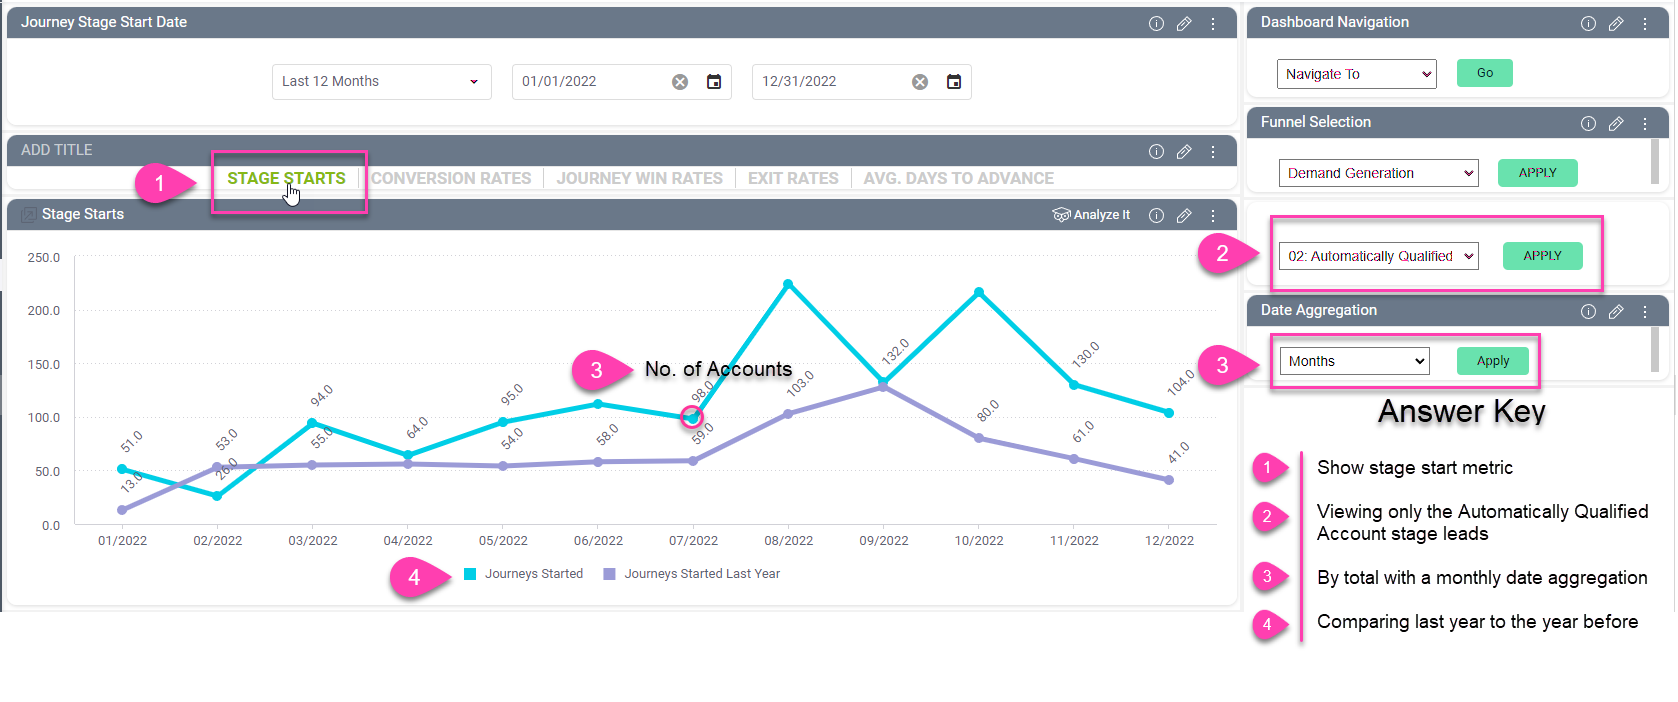
- Conversion - I want to see what is happening with my conversion rate.
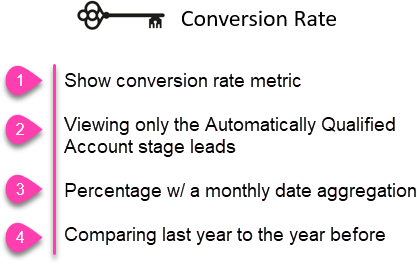
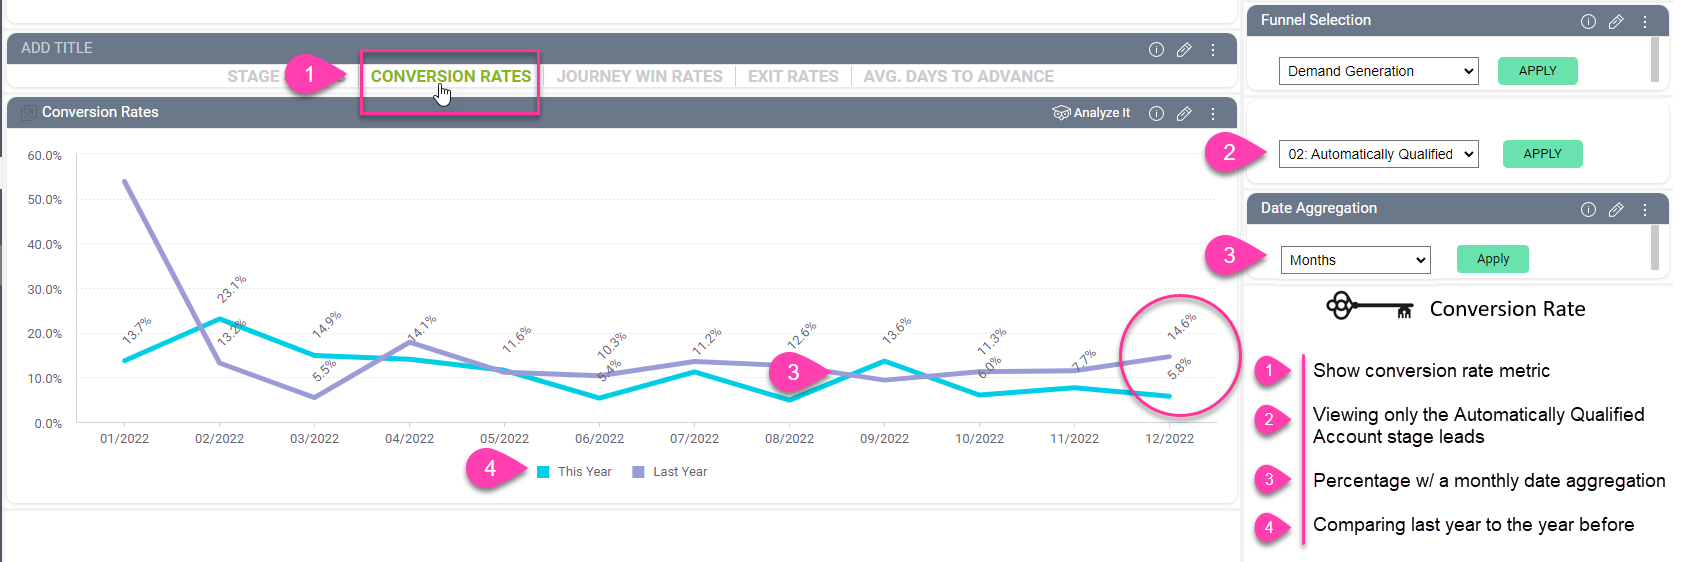

Analysis: Notice that at the end of the 2022 year our data shows that we are below the industry standard of 11% conversion rate.
Action: As a marketer we would ask the following questions:
- Do we have a good understanding of our target market?
- Are we trying to appeal to the correct personas?
- Do we have an offer that's compelling enough for them to engage with Sales?
Solution: Collaborate with sales and mitigate gaps and issues are found with tweaks to ICPs and offers. Watch data closely for changes both good or bad. Rinse and repeat.
- Time in Stage - How long does it take for leads to advance from one stage to another?
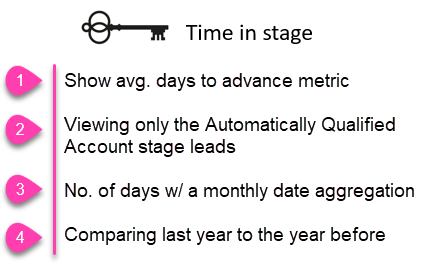
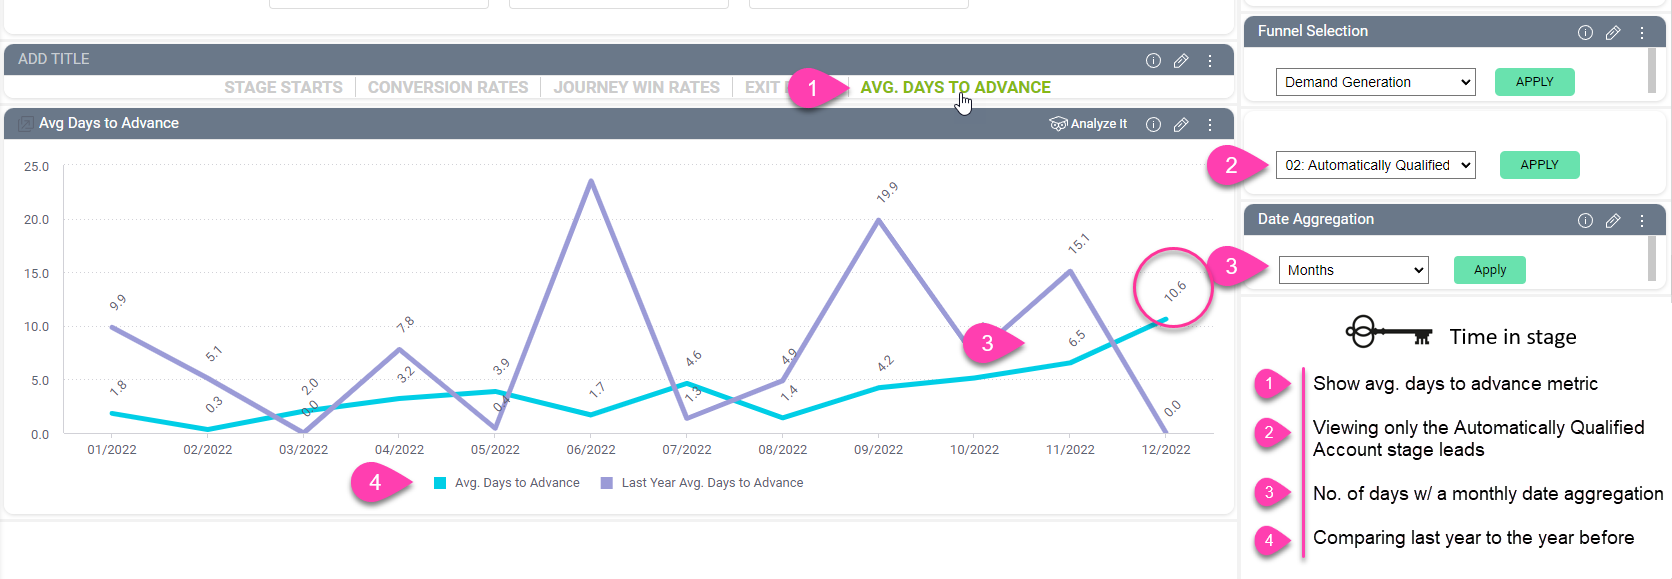

Analysis: Notice that at the end of the 2022 year our data shows that we are well above last years days to advance and we need to begin to investigate what is causing the blockage.
Action: As a Marketer I would begin by interrogating the targeting and messaging and conversion rate statistics earlier in the funnel to see whether or not there is a problem. Take a look at Sales and ask about lead follow up timelines (i.e. how long is it taking Sales to follow up on leads and how many leads are actually being touched?)
Solution: If the follow up time - as indicated in this dashboard above - has increased it is time to make sure you are targeting the right people - ask "am I bringing in low quality leads with low intent?" Look at what is converting well with accounts booking meetings and then gating the content that gates at a very LOW rate. A good idea is to determine what are the 3 highest converting channels and then apply and ICP filter to the ones below these. Also, there are some tactics that are not passed through to sales but are placed in a nurture program.
On the sales side of the house it's important investigate the need for gap sales training as well as develop or refine an SLA for lead follow up. Once all measures have been attacked it is important to closely manage both marketing and sales efforts and for improvements and needs to tweak the processes. Rinse and repeat.