
Web Content Overview: Funnels Report
October 22, 2026
This report provides a comprehensive view of website traffic and content performance mapped across each stage of the B2B buyer journey, from early awareness to late-stage opportunities. Key data elements include:
Primary Use Case: Content Optimization and Pipeline Acceleration
A B2B demand generation or content marketing team can use this report to evaluate content effectiveness across the buyer journey. For example, by analyzing which pages accounts view during the MQA (Marketing Qualified Account) and SQO (Sales Qualified Opportunity) stages, marketers can determine which whitepapers, product pages, or case studies actually support mid-to-bottom funnel progression. If high-value pipeline stages show low engagement with key product pages, marketing can revamp distribution, retargeting, and sales enablement strategies to deliver the right content at the exact moment accounts enter critical decision stages.

KPI Metrics
- Unique Visitors Last 30/Unique Visitors Last 30 – This widget gives you a quick health check on recent audience acquisition by showing how many unique people visited your website in the last 30 days compared to the prior 30 days, along with the percentage change.
How it is calculated: It counts unique visitors during the most recent 30-day window and compares that figure against the count from the preceding 30 days to calculate the net growth or decline. - Avg. Page Views per Journey – Measures the depth of content consumption across accounts by displaying the average number of pages viewed per funnel journey How it is calculated: It sums up the total number of pageviews during a buyer journey for all journeys, and then averages those numbers together

Page Views in Stage Over Time
Tracks the monthly progression of web engagement across every funnel stage, helping marketers see how content consumption shifts as prospects move from early interest to late pipeline stages.
How it is calculated: Each tracked page view is assigned to the buyer journey stage that was active at the time of the visit. The events are then aggregated by month and stage to demonstrate historical volume trends.
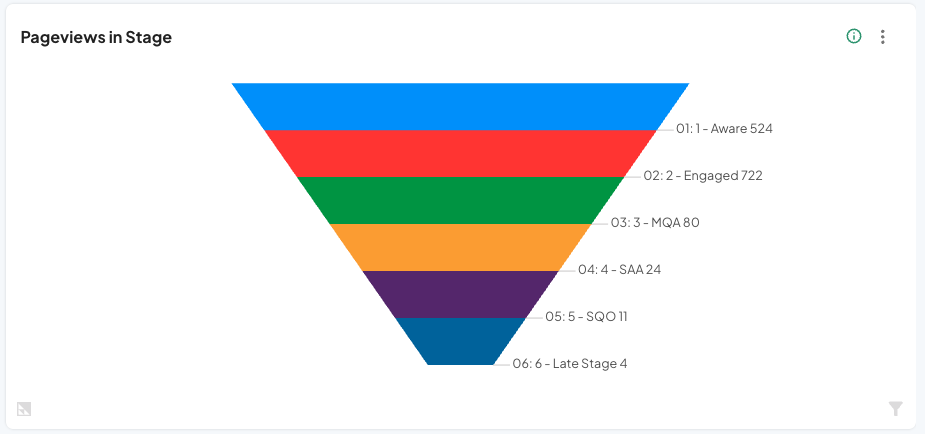
Pageviews in Stage
A funnel view showing the total volume of page views that occurred within each specific buyer journey stage, highlighting which stages capture the bulk of web research.
How it is calculated: It maps recorded page views to their corresponding buyer journey stage and sums the total page view counts across each stage for all active journeys.
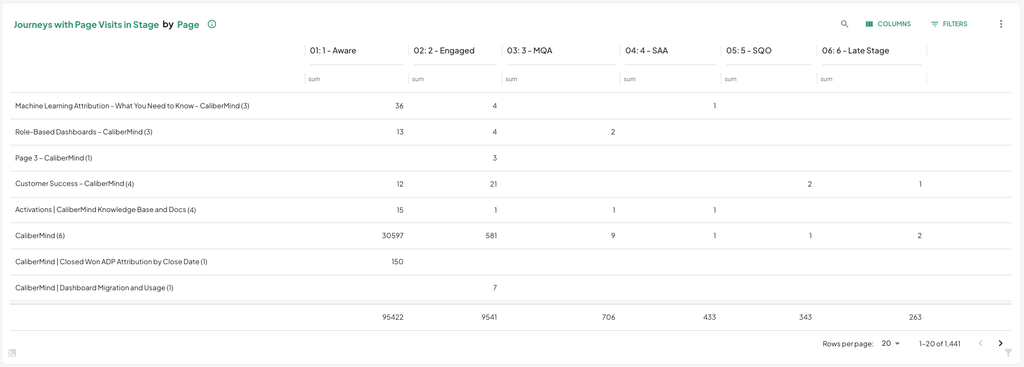
Journeys with Page Visits in Stage by Page
A breakdown of web content performance across specific journey stages, showing which web pages, URLs and Page Paths engage buyer accounts at each point in the funnel.
How it is calculated: Web page interactions are joined with journey progression data and funnel stages to calculate engagement metrics for each page title across every funnel stage.
Here is what each column in this table represents:
- Group by: A user selectable grouping with options including page, url, and path
- Stage Name: The sequential funnel stage name corresponding to the stage where the web visit took place.
- Measure: A user selectable grouping with options including “Journeys with page visit in stage,” “First touch in Stage”, “Last Touch in Stage”