
Web Content Overview: Engagement Report
October 22, 2026
This report provides an engagement overview for a B2B organization engaging in digital marketing.
Practical Use Case: Content Strategy and Budget Allocation
A key use case for this data is Content ROI and Conversion Path Optimization.
In B2B marketing, KPIs like raw page views often obscure which web experiences actually drive engagement. By evaluating Page Views alongside weighted Contribution to Score, marketing operations and demand generation teams can make better Content decisions by seeing what is most impactful vs. just what is receiving the most views.

KPI Metrics
- Unique Visitors Last 30/Unique Visitors Last 30 – This widget gives you a quick health check on recent audience acquisition by showing how many unique people visited your website in the last 30 days compared to the prior 30 days, along with the percentage change.
How it is calculated: It counts unique visitors during the most recent 30-day window and compares that figure against the count from the preceding 30 days to calculate the net growth or decline. - Contribution to Score – This card widget displays the total cumulative engagement score attributed to web pages during the selected time window.
How it is calculated: The query filters page view activity to eligible visits (filtering for the target date range), and then sums the engagement score each page view generated - Scored Companies/Scored People – This metric card shows the count of unique accounts (companies) and individual persons that accumulated engagement score during the selected timeframe.
How it is calculated: Using the distinct page view touch points within the specified date range, It counts unique companies to calculate scored companies, and unique people to calculate scored individuals.
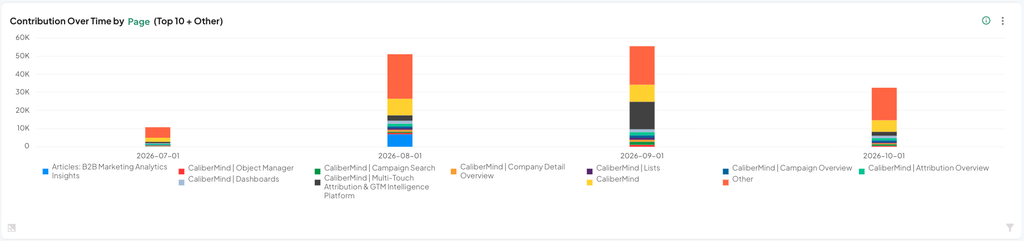
Contribution Over Time by Page (Top 10 + Other)
A monthly trend chart widget that illustrates how engagement score is distributed across website content over time. It highlights the top 10 performing (Page Titles, Domains, UTM Campaign, UTM Source, UTM Medium, UTM Content) while grouping all remaining pages into an Other category.
How it is calculated: The query aggregates the raw touch score for each (Page Titles, Domains, UTM Campaign, UTM Source, UTM Medium, UTM Content) per month. It then determines the top 10 page titles by lifetime score contribution across the period; any page falling outside the top 10 is classified as Other.
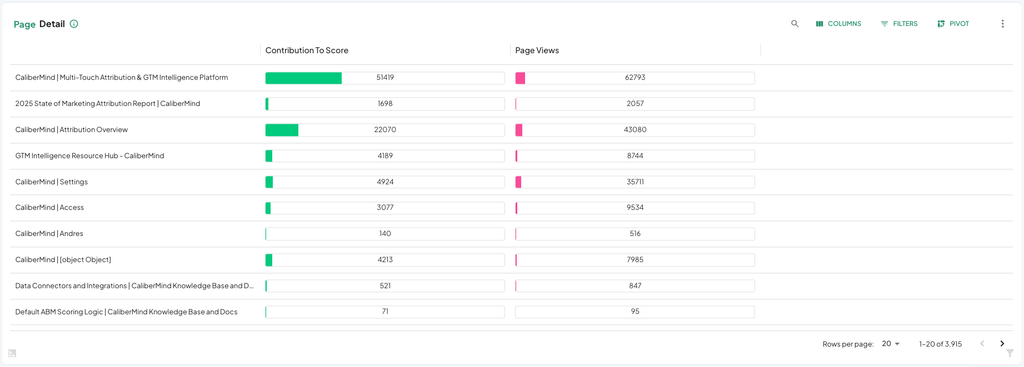
Page Detail
A comprehensive tabular report that breaks down engagement score performance and traffic volume across individual (Page Titles, Domains, UTM Campaign, UTM Source, UTM Medium, UTM Content).
How it is calculated: Each pageview is grouped based on the selected dimension. Pageviews are then counted and the engagement scores generated are summed.
Here is what each column in this table represents:
- Group by: Displays the (Page Titles, Domains, UTM Campaign, UTM Source, UTM Medium, UTM Content) associated with the visited URLs.
- Contribution To Score: Calculated by joining distinct (Page Titles, Domains, UTM Campaign, UTM Source, UTM Medium, UTM Content) event IDs and taking the sum of the engaged score.
- Page Views: Calculated by counting distinct events logged for each (Page Titles, Domains, UTM Campaign, UTM Source, UTM Medium, UTM Content) during the period.