
Web Content Overview: Summary Report
October 22, 2026
This Report provides a comprehensive overview of B2B website engagement, audience acquisition, and conversion performance over the selected period. Specifically, it tracks:
Strategic Use Case: Content and Channel Investment Optimization
A marketing leader can use this data to identify which content assets are the most consumed and see which people and accounts are viewing them. For instance, while broad ad campaigns or third-party aggregators might drive raw volume, this report lets you pinpoint which specific assets, such as your Solutions page or a webinar series, attract the highest ratio of identified target accounts and form fills. You can justify your efforts by shifting budget away from low-converting referral sources toward channels and content topics that reliably deliver qualified accounts to the sales team.

KPI Metrics:
- Unique Visitors Last 30/Unique Visitors Last 30 – This widget gives you a quick health check on recent audience acquisition by showing how many unique people visited your website in the last 30 days compared to the prior 30 days, along with the percentage change.
How it is calculated: It counts unique visitors during the most recent 30-day window and compares that figure against the count from the preceding 30 days to calculate the net growth or decline. - Avg. Pages per Visit – This metric indicates audience engagement depth by displaying the average number of web pages a user browses during a single visit. A higher number typically signals that visitors find relevant resources and navigate deeper into your site.
How it is calculated: The platform groups web activity into individual visitor sessions, tallies the total page hits recorded within each session, and takes the average across all sessions in the selected timeframe. - Avg. Visit Duration (in Minutes) – This widget helps you understand time spent on site, measuring how long visitors remain active per session.
How it is calculated: For every visit, it subtracts the timestamp of the first page hit from the timestamp of the last page hit to determine session length in minutes, then calculates the overall average across all sessions. - Form Fills – This conversion metric tracks high-intent buyer actions by reporting the total number of completed form submissions and event registrations.
How it is calculated: It filters all tracked interaction events down to those classified as form submissions, event registrations, or related form fills, and counts the unique event IDs across the date range.
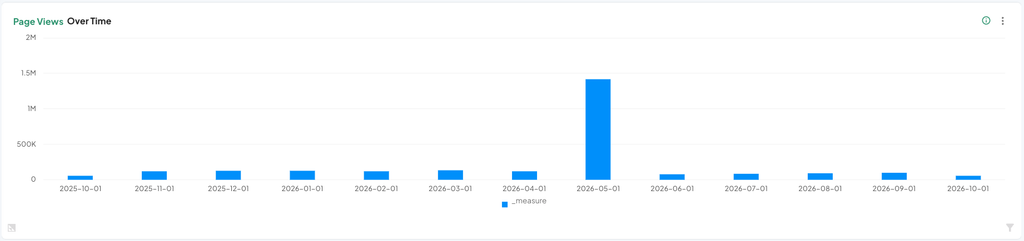
Page Views Over Time:
This trend chart visualizes how overall website content consumption moves month by month over the past year, making it easy to identify seasonal patterns, campaign launches, or traffic surges.
How it is calculated: It groups all Page Views, Known Companies, Known Visitors and Total Visitors by calendar month and calculates the total count of page views for each monthly interval.
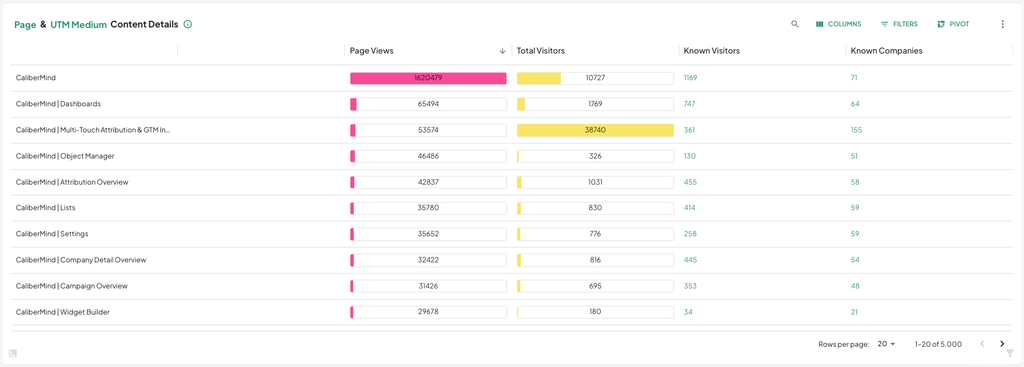
Content Details Table:
This detailed performance table breaks down your top Pages, Page Paths and Domains with additional UTM Sub-Groupings to show which specific assets attract the most volume and account-level engagement.
How it is calculated: The underlying query groups website traffic by Pages, Page Paths and Domains, aggregates total views and unique identifiers (both individual and account-level)
Here is what each column in this table represents:
Group by 1: The primary grouping category options are Pages, Page Paths and Domains
Group by 2: A secondary grouping category that can be disabled by choosing “No Selection” has the grouping options of UTM Campaign, UTM Source, UTM Medium
Page Views: The total number of times this specific page was viewed.
Total Visitors: The count of unique visitors (anonymous and identified) who landed on this page.
Known Visitors: The number of visitors on this page who have been identified and tied to a known contact record.
Known Companies: The number of unique corporate domains or accounts matched to visitors of this page.