System Overview
Getting Started
Signing In to CaliberMind
New to CaliberMind - Start Here!
How to use Dashboards
How do I use CaliberMind's search functionality?
CaliberMind Home Page & Navigation
Digital Marketing Terminology
How Does CaliberMind Define a "Channel"?
What Is a CaliberMind Event or Event Table?
Account Detail (Search Result) Results
Opportunity Search Results
Campaign Detail Search Results
Person Detail Search Result
Connectors / Integrations
Adding Your First Connector
How To Connect AdRoll / RollWorks
How To Connect Google Analytics
How To Connect HubSpot
How To Connect LinkedIn Ads
How To Connect Marketo
Kickfire
Overview of Connectors
ZoomInfo / DiscoverOrg
CaliberMind IP Addresses for Whitelisting
Setting Up the LinkedIn Push Connector
Connecting Tableau to CaliberMind
CaliberMind Data Export to Google Cloud Storage
Ingesting CaliberMind Data Into Snowflake
Klaviyo connector [Via Fivetran]
In-App Notifications
Google Sheets
Segment Connector [via FiveTran]
Pushing Caliber Mind Person Engagement Data to Salesforce
Integrations Appendix by Connector
Act-On
SFTP Connector - Updated 2021
Connecting Your Data Warehouse to CaliberMind
Replicating CaliberMind Attribution Data to Salesforce
Salesforce Connector [via FiveTran]
Connector Health and Web Tracker Health reports
How to Connect Facebook Ads
KickFire De-Anonymization in CaliberMind
Connecting G2, Bombora, or 6sense
CaliberMind Connectors
Field History SFDC Limits (Salesforce)
SFTP Synced Files - Making a Data Change
How To Connect Outreach
CaliberMind Connectors - Start Here!
Power BI/ Tableau/ Looker Connectors Article
Google Ads Connector (via FiveTran)
Pardot Connector [via FiveTran]
Connections - Email Notifications
CaliberMind Data Access FAQs
Twitter API Connector via Fivetran
Microsoft Bing Connector
Setting Up the Salesforce Push Connector
How To Connect Microsoft Dynamics
Bing/Microsoft Ad's Connector
Connectors Status Page
Developer Guide
CaliberMind Entity Relations and System Tables
Developer Guide - Start Here!
What is Google BigQuery
CaliberMind Common Data Sources
CaliberMind Identity Levels
System Configuration
Object Mapping Filters
How to Map Your Salesforce Opportunity Revenue Field
Custom SQL Data Transformations
Remove a BigQuery User within CaliberMind
Object Manager: Campaign Member
Setting Your Saved Filters for In-App Reporting
Object Mapping: Create a Filter
Object Mapping: Create a Mapping
Adding Custom Columns in Salesforce
Add BigQuery Users within CaliberMind
Custom Configuration for Object Mapping
Object Mapping: Create a Replacement
How to Email CaliberMind Reports
Setting Up UTM Mapping in CaliberMind
Standard Channel Logic
Channel Ranking Logic
Setting Up Account Trend Emails
UTM Parameters Formatting and Best Practices
Object Mapping for Filters - Start Here!
How to See Your Object Manager History and Revert Back to Previous Versions
Object Mapping: Create a Campaign Substitution
List Builder
What are Lists?
Importing a List
Account List Upload File Requirements
Keyboard Shortcuts using SQL
Creating an Account List From a Campaign
How to create a list of all Opportunities that have a very low Engagement
People List Upload File Requirements
Campaign List Upload File Requirements
Use Case Videos - Creating a List Using the List Builder
Creating a List Using the List Builder - Step-by-Step Instructions
Creating Company Lists using SQL
List Builder - Start Here!
Creating Company Lists in List Builder
Where is my Segments Menu?
Downloading a List - Step-by-Step Instructions
Web Tracker Installation & Settings
Installing AnalyticsJS (CaliberMind snippet)
Two ways to identify prospects that submit a form containing email address using AnalyticsJS
Install AnalyticsJS on a HubSpot website
Using AnalyticsJS Identify on embedded Hubspot forms
Using AnalyticsJS Identify on embedded Marketo forms
Types of Analytics.js Calls
Analytics.JS Overview
Using Analytics.js to Track Web and Product Events
Web Tracker and Installation Settings - Start Here!
How Cookie Settings Affect the Analytics.JS Tracking Script
Google Tag Manager (GTM) Ad Blockers
Using AnalyticsJS with Drift
How to check your AnalyticsJS implementation
Using AnalyticsJS with Qualified
Flows
Flows Status Page
How to use QuickFlows
Merge records in Salesforce CRM
Add a Quick-Flow to Salesforce Campaign
Using ClearBit Flows
CaliberMind's Most Popular Flows | Automations
Setting Up Workflow - Lead Deduplication
ZoomInfo - Add-to/Enrich your database
Setting Up Workflow - Website Repair
Setting Up Workflow - Account Deduplication
Creating Sales Campaigns from Salesloft and Outreach Activities
Setting Up Workflow - Contact Deduplication
Campaigns
Campaign-Program Membership
Program Logic for Campaigns
Custom Campaigns
Custom Programs for Campaigns
Campaigns - Start Here!
Setting Up Answers
Setting Up Answers - Start Here!
Using CaliberMind Answers to Understand Funnel Impact
Using CaliberMind Answers to Understand Campaign Performance
Using CaliberMind Answers to Understand Funnel Performance
Using CaliberMind Answers to Understand Account Engagement
Using CaliberMind Answers to Understand Funnel Flow
User Administration & SSO
Single Sign On (SSO) Setup
Manage Users - Viewing, Inviting, Updating Users and Roles
CaliberMind Data Warehouse Access in Google BigQuery
Administration and SSO - Start Here!
User Authentication and Provisioning
Identify users using Intercom Messenger
GDPR Compliance with CaliberMind
Data Dictionary
Attribution
Analytics
Attribution
Removal effect with a Markov chain model
Attribution Reports Summary
Attribution - CaliberMind versus Embedded Attribution in Salesforce?
Analytics: People Tab in Attribution Overview
Analytics: Opps Tab in Attribution Overview
Virtual Campaigns in CaliberMind
Campaign Types - Best Practices for Easy-to-Read Attribution
Analytics: Comparisons Tab in Attribution Overview
Analytics: Events Tab in Attribution Overview
Analytics: Summary Tab in Attribution Overview
Analytics: Explore Tab in Attribution Overview
Demand Generation
Data Integrity
Customer Success
Understanding Reports
CaliberMind Analytics Concepts
Overview of Analytics and Attribution
Filters and Hyperlinks
Using the Engagement Trending Report
Using Tags to Organize Your Lists
Attribution Overview - Campaign Performance Table
Using Campaign Lists in Dashboards
Using Account Lists in Dashboards
CaliberMind Metrics Definition
Product Attribution Dashboard
Attribution Models: First-Touch
Self-Hosting CaliberMind AnalyticsJS
ROI
Revolutionizing Marketing ROI: CaliberMind's Innovative New Approach
Return On Ad Spend Dashboards
Revenue Contribution Reports Summary
Channel ROI Overview
Creating and maintaining a custom advertising budget for ROAS
Best Practices for Tracking Return-on-Ad-Spend (ROAS)
Why Is CaliberMind ROAS or ROI Different Than My Ad Platform?
Campaign ROI Overview
Budget for ROI Channel Reporting
Attribution Models
Funnels
In-App Funnels
CaliberMind Insights
Working in CaliberMind Insights
CaliberMind Insights - Browser Requirements
CaliberMind Insights - Sharing Dashboards & User Permissions
CaliberMind Insights - Navigating to Insights/Dashboard
CaliberMind Insights - Using Dashboards
CaliberMind Insights - Dashboard Refresh Schedule
CaliberMind Insights - Application Concepts and Terminology
CaliberMind Insights - Filters & Aggregation Type
Creating a Custom Pipeline Dashboard (VIDEO)
CaliberMind Insights - Creating Custom Dashboards
How to Create a Filter Bookmark
Building Insights Dashboards
Build Your Own Insights Pipeline Dashboard
Building Formulas with Functions
Creating and Editing a Widget Formula
Using Conditional Statements
Build Insights Dashboards - Start Here!
Create Date Range Filters - Step-by-Step
Creating Formulas Based on Criteria and Conditions (Filters)
Calculated Fields
Dashboard Function Reference
Shared Formulas
Introduction to Formulas - Start Here!
Using Quick Functions
Insights Dashboards
Insights Attribution Dashboards
Insights - Attribution - Start Here!
Insights - Attribution Terminology and Key Concepts
Insights - Attribution Overview Dashboard 2.0
Insights ROAS Dashboard
Insights - ROAS Dashboard Use Cases
How is CaliberMind ROAS Reporting Different than Insights ROI?
Insights - ROI - Start Here!
Insights - ROAS Terminology & Key Concepts
Insights Engagement Dashboard
Insights - Engagement - Start Here!
Insights - Engagement - Dashboard Terminology & Key Concepts
Insights - Engagement Overview
Insights - Engagement - System Account Detail
Insights - Engagement - Person Detail
Insights Engagement Dashboard - Aggregation Dates
Insights Data Health and Integrity
Funnel Trigger Events Dashboard
Funnel Company Inclusion Configuration
What is a Marketing Funnel?
Event Explore for Funnels
Funnel Terms and Concepts
Common Funnel Issues
Funnels FAQs Technical Documentation
Funnel Configuration
Funnel History Event Configuration
Funnels - Start Here!
What channels move journeys through a given stage?
Funnel Stages Configuration and Stage Definitions
Funnel Trend Dashboard
How can I see the number of journeys in or passing through a funnel stage during a period of time?
Sales Funnel Metrics
What touches are influencing each step in the funnel?
How do I see the first event (or "tipping point") in each stage of my funnel?
Funnel Events Technical Documentation
Marketing & Sales Funnel Foundations
Funnel Static Event Configuration
What is a Starter Funnel?
Funnel Person Inclusion Configuration
Funnel Cohort Analysis Dashboard
Sales Funnel Glossary
Where are my customers stuck in journeys?
Funnel Cohort Analysis Use Cases
Funnel Data Explore Dashboard
Use Cases for Funnels
Sales Funnel Journey Questions and Answers?
What is the difference between an Active Journey and a Journey?
How do I know the last event that happened before a journey stage change?
How do I identify stage conversion rates?
Funnel Person Status Exits
Introducing CaliberMind's Funnels
Funnels - Lead, Contact, Account, Opportunity Statuses and Stages
Pressure Event Dashboard 101
Funnel Stage Definitions
Demand Generation Funnel Dashboard
Engagement and ABM
Engagement Scoring
Model Configuration
Insights - Create Multiple Engagement Score Models
How to Change Event Touch Scores
Sales Opportunity Data Model
Engagement Scoring Time Decay - How It Works & How to Change It
Engagement Scoring Models Overview
Custom Attribution Configuration - Custom Weighting
How to Add or Change Engagement Score Multipliers
Add or Change Engagement Score Filters
Using Engagement Score to Trigger an Update in Salesforce
Which touches and events are we scoring?
Customize Engagement Scoring Models - Start Here!
Default ABM Scoring Logic
Engagement Reporting
Account-Based Marketing Reports
Engagement: Summary Tab
Engagement Overview: Companies Tab
Engagement Overview: People Tab
Engagement Overview: Campaigns Tab
Engagement Overview: Explore Tab
Linking to CaliberMind Reports in Salesforce
ABM Best Practices
Tutorials and Use Cases
Customizing Report Visibility (Show/Hide)
How to Manage Your Offsite Events Using CaliberMind
How can I manage my BDR/SDR team activities with CaliberMind?
Combining Engagement Score with Attribution
Enabling the Sales Teams to see the Entire Buyers Journey
How Can I Identify High Risk Opportunities?
How does Sales leverage CaliberMind? Some key use cases.
Running a Sales/Pipeline Review with CaliberMind
How Is CaliberMind Different From My CRM Attribution?
CRM Campaign Member Status and Campaign Response Best Practices
How Do I Optimize Advertising Spend?
Campaign Best Practices Across Systems
How do I use CaliberMind to shorten our sales cycle?
Answering Business Questions Using CaliberMind Reports
Which of my leads are the most engaged?
How Do I Know If a Campaign Is Good or Bad?
How to Flatten Your Campaign Structure in Salesforce
Table of Contents
- All Categories
- System Overview
- Setting Up Answers
- Using CaliberMind Answers to Understand Funnel Impact
Using CaliberMind Answers to Understand Funnel Impact
 Updated
by Angie C.
Updated
by Angie C.
Most businesses organize their sales and marketing practices around the idea of a funnel. The general hope is that more leads coming into the top will lead to more customers coming out of the bottom. Monitoring and understanding the various parts of a company's funnel is an essential practice for sales and marketing professionals to understand what worked, what didn’t, and how things are going right now.
The most common question CaliberMind Funnel users ask is “What things are having an impact on getting potential customers to move through my funnel?” This question touches on several potential areas of interest including specific campaigns, channels, industries, and more. Traditionally, getting insight into this question requires wading through multiple dense tables of data and supplementary analysis.
With CaliberMind Answers, we aim to dramatically simplify this process by providing a flexible and interpretable way to highlight exactly what is and is not working to drive journeys through the various stages of your funnel.
How Do I Set This Up?
The Funnel Impact Answer within CaliberMind is designed with ease of use and flexibility in mind. With a few simple configuration steps, you can get an idea of what tactics and characteristics impact success in your funnel the most.
Below we detail the various configuration options available to users.
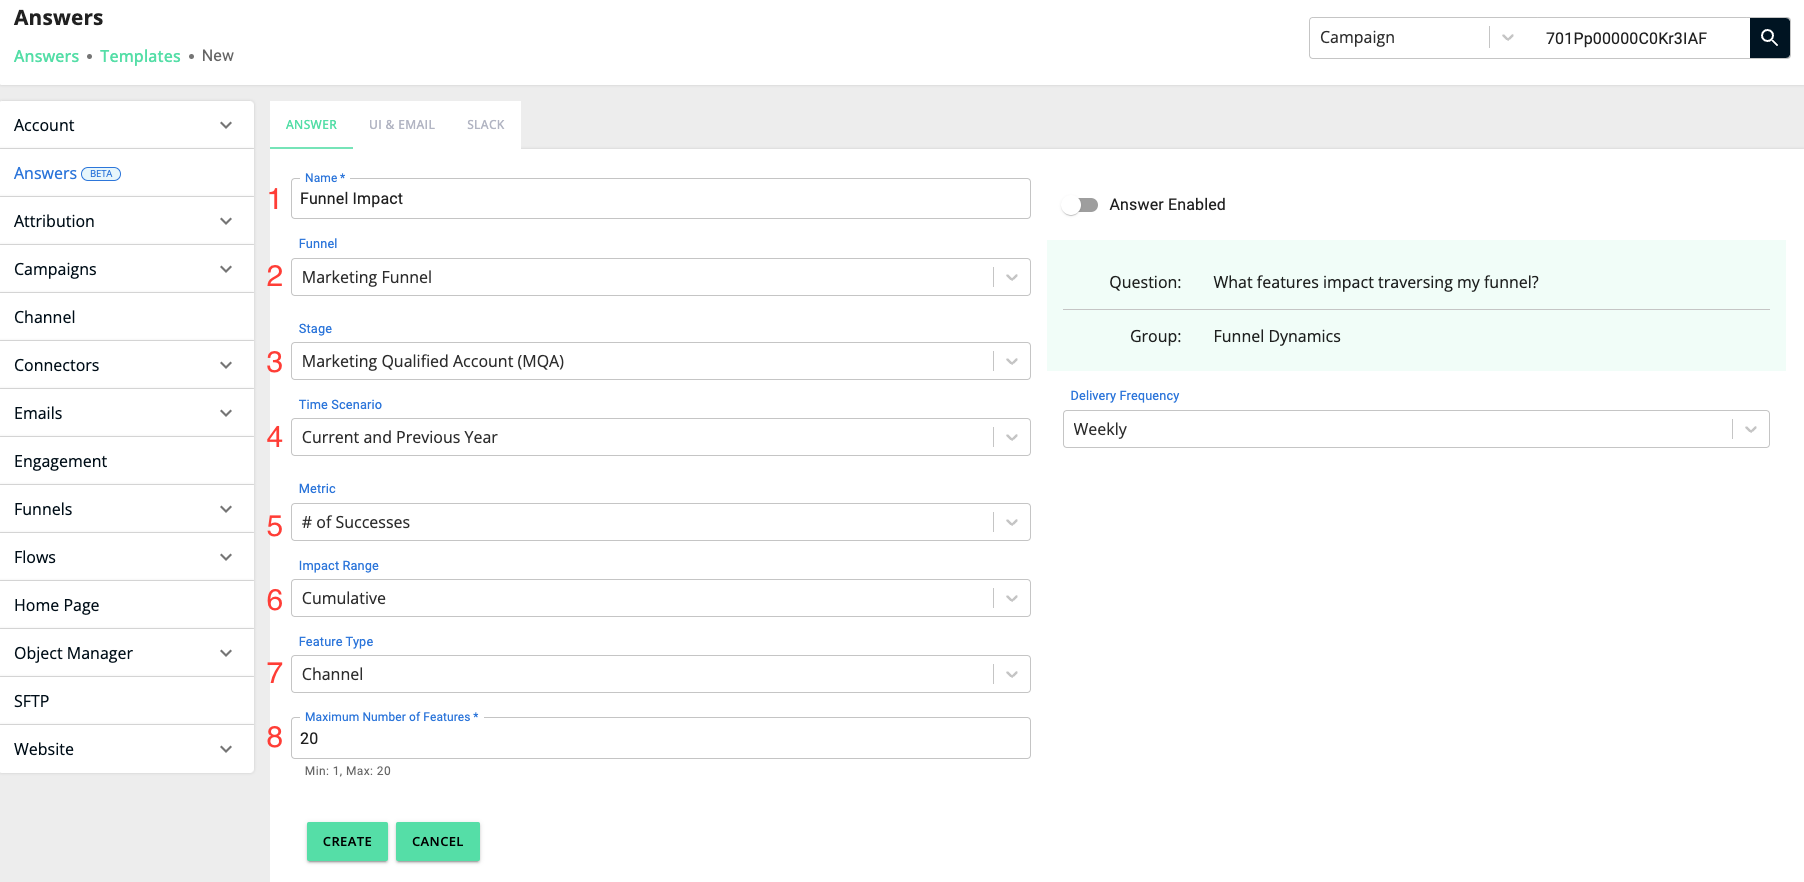
(1) Name
This field allows users to give their answer a unique name to identify them across CaliberMind quickly.
(2) Funnel
The name of the funnel the user wants to learn about. These names are defined in the underlying Funnel configuration.
(3) Stage
The name of the funnel stage on which you wish to measure impact. For example, setting this value to “Marketing Qualified Account” would be primarily concerned with what impacts the most reaching Marketing Qualified Account.
Currently we support stage selection for all stages save for the first stage of a funnel. This is due to the interstage nature of studying events once a journey has begun. Future enhancements will include the ability to analyze the funnel entry stage as well.
(4) Time Scenario
This parameter allows users to define the most appropriate period for analyzing their funnel. Long time ranges, such as This and Last Year, are useful for understanding broad historical trends. In contrast, shorter time ranges, such as Past 90 Days, are more appropriate for analyzing the impact of recent decisions.
(5) Metric
This parameter allows users to control what metrics they use to measure impact.
- # of Successes: This is a count of all journeys that exhibited the feature of interest that reached a given stage. This measure is useful when a user is concerned primarily with funnel volume.
- % of All Successes: This is the proportion of all journeys that reached a particular stage that exhibited the feature of interest. This measure is useful when users are interested how prevalent certain attributes are at given stages.
- Probability of Success: This is a measure of how likely journeys are to reach a certain stage given that they are tied to a specific feature. This measure is useful for understanding the likelihood of moving through the funnel given the presence of certain tactics or characteristics.
- Impact on Odds: This is a measure of how the presence of a feature affects reaching a certain stage compared to examples where that feature is missing. This measure is useful for understanding the scale of impact in relation to baseline activity. Specifically, this is the ratio of odds of success for cases with our feature to the odds of success for cases without our feature.
Example:
We are interested in understanding how various campaign types impact reaching the Marketing Qualified Account (MQA) stage of my funnel. Over the past quarter, we’ve observed the following:
- 200 journeys reaching the MQA stage.
- Of those 200 journeys, 42 of them could be tied to Content Download.
- Overall, we saw 100 journeys tied to Content Download. 42 of these reached MQA with the other 58 failing to reach this stage.
- Overall, we saw 500 journeys not connected to Content Download. 158 of these reached MQA while the other 342 failed to reach the stage.
With these values, we can easily calculate the metrics for Content Download as described above.
- # of Successes = 42
- % of All Successes = 42/200 = 21%
- Probability of Success = 42/100 = 42%
- Impact on Odds = (42/58) / (158/342) = 0.7 / 0.46 = approximately 1.5.
These metrics can be interpreted as saying we have a 42% chance of reaching MQA when we observe Content Download. This leads to an approximate 1.5 x improvement on the odds of reaching MQA compared to our baselines.
The current recommendation is to use Probability of Success as the initial metric when exploring funnel impact.
(6) Impact Range
This parameter controls how we connect various events to funnel journeys. Currently there are two options available.
- Stage-to-Stage: This option only looks at what occurs in the directly preceding stage when figuring out stage-level impact. This is useful when users care about understanding how timing of certain tactics could help move journeys forward.
- Cumulative: This option looks at all events from initial funnel entry up to the stage of interest. This is useful when users care less about timing but more about the composition of successful journeys as a whole.
Example:
We are trying to understand how various channels impact reaching the stage 4 of our funnel. The Stage-to-Stage option would only look at the impact of channels immediately preceding stage 4. If there are no backfills, this would specifically be events occurring between stage 3 and stage 4. The Cumulative option would look at the presence of channel interactions between the start of the funnel and stage 4.The current recommendation is to use Cumulative as the default impact range to avoid potential issues surrounding backfilled stages.
(7) Feature Type
This parameter controls what is set as the event-level characteristic of interest. Depending on the selection, users are able to explore the impact of marketing tactics, industry dynamics, technographics, and more.
- Campaign: The name of specific campaigns set up by the user.
- Campaign Type: A classification used to group similar campaigns together. This is dependent on the user’s underlying data. Examples could include things like Paid Social, Organic Google, Content Download, etc.
- Channel: The channel that received credit for driving a particular interaction. Examples could include Direct Mail, Paid Search, etc.
- Department: The department associated with people who are interacting with a specific journey. Examples could include Marketting, IT, Sales, Finance, etc.
- Industry: The industry associated with companies interacting with a particular journey. Examples include Advertising, Industrial Equipment, Finance, etc.
- Job Level: A standardized measure of the seniority associated with people who are interacting with a specific journey. Examples include VP, Functional, CXO, Director, etc.
- Title: The specific title of people interacting with a given journey. Examples include Senior Director of Operations, Vice President of Demand Generation, Chief Marketing Officer, etc.
(8) Maximum Number of Features
This parameter controls the maximum number of features returned for stage-specific impact assessment in the resulting exploration visualization. Rankings are determined by the impact metric for the specific stage that has been configured.
How Do I Use This?
Once you have set up your Answer, you will have access to a curated exploration page focused solely on your version of the question at hand. This is in addition to the generated insight that is delivered to you. This page provides both high-level and deeper insight into your data. The screenshot and breakdown below provide supplementary information about using and interpreting this information.
(1) Answer Name and Configuration Panel
This section provides the current configuration for this Answer. Often times this information is useful in differentiating use cases and providing additional context for discussion.
(2) Answer
Rather than just give users a multitude of reports to wade through, CaliberMind aims to provide a curated experience for understanding and interpreting the data at hand. This section provides a high-level answer to the core underlying question being considered. This statement is limited to 1-2 lines of concise information. This is the same value that is listed on the My Answers page for this specific question.
(3) Feature By Stage Heatmap
This heatmap shows the metric of interest for each combination of feature and funnel stage. This allows users to easily discern which characteristics are important for each stage and compare them across their funnel. Some key notes regarding the usage and interpretation of this graphic:
- Values within a given stage column refer to the impact on arriving into that stage. For example, a value of 42 total successes in the Marketing Qualified Account (MQA) column is referring to the number of journeys with a given feature that made it to the MQA stage.
- As mentioned in the configuration section, we currently support analyzing all funnel stages except the initial entry stage. This is due to the interstage nature of studying events once a journey has begun. Future enhancements will include the ability to analyze the funnel entry stage as well.
- The features included on the vertical axis are the top features ranked according to their impact metric for the configured stage of interest.
- Ex: If Sales Accepted Opportunity (SAO) is selected as the stage, Channel is selected as the feature, and 5 is selected as the maximum number of features, the vertical axis would be the top 5 channels by impact to SAO
- Each cell is classified into one of the following categories based on comparisons within a given stage.
- Normal Impact: The metric falls within the normal range for a given stage.
- Above Normal Impact: The metric is significantly higher than the normal range for a given stage.
- Below Normal Impact: The metric is significantly lower than the normal range for a given stage.
- Negative Impact: The metric indicates that the feature in question has a negative impact on the stage in question.
- Not Enough Information Available: There isn’t enough information available to classify the metric in question.
Note that Negative Impact and Not Enough Information Available only occur for the Impact on Odds metric.
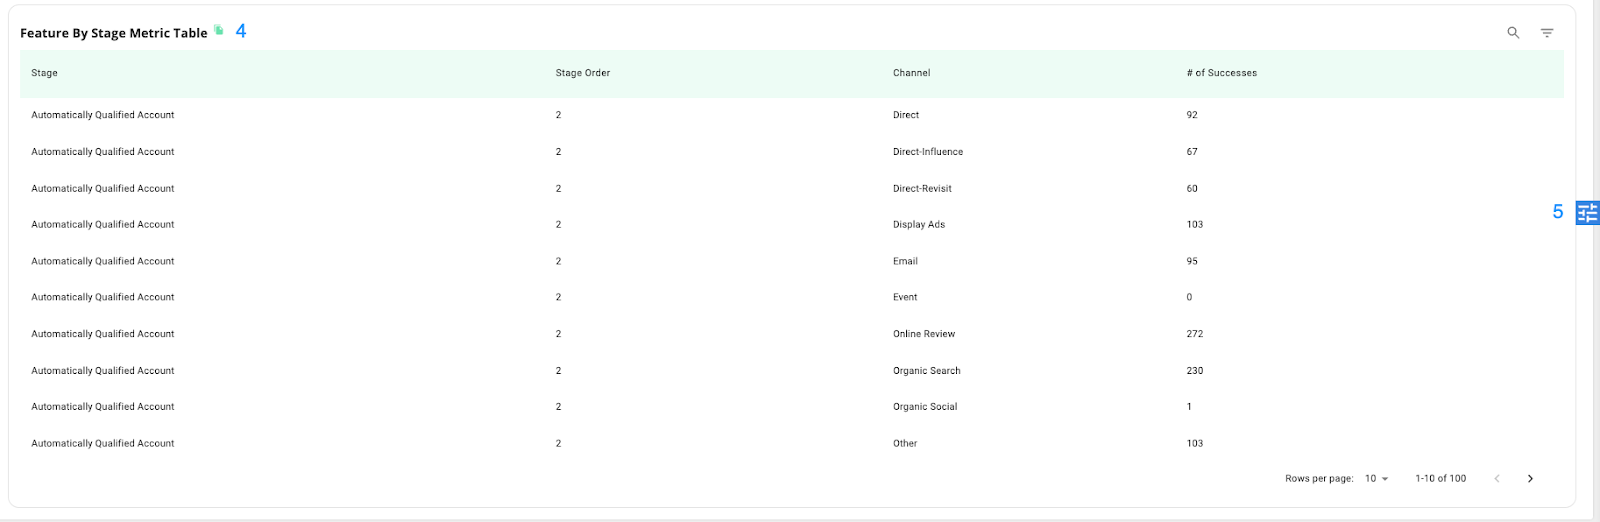
(4) Feature by Stage Metric Table
This table is an extension of the data shown in the heatmap. This data is more comprehensive since it does not limit by the maximum number of features selected. The table columns are described below:
- Stage Name: The stage of interest for a given metric.
- Stage Order: The associated stage order for a given stage name.
- Feature Column: This column is dynamic depending on the Feature Type that was selected (Channel, Campaign, etc.).
- Metric Column: This column is dynamic depending on the metric selected (# of Successes, Probability of Success, etc.)
By default the metric column shown is the one that is configured for the Answer. All other metrics of interest are available in this table by selecting them from the table menu in the top right of the widget.
(5) Filter Tray
Options in the filter tray allow for exploration and on-the-fly changing of a small subset of Answers configuration. Here, we enable the ability to change the funnel stage of interest as well as the feature type. These changes do not affect the underlying configuration.