System Overview
Getting Started
New to CaliberMind - Start Here!
CaliberMind Home Page & Navigation
Signing In to CaliberMind
How do I use CaliberMind's search functionality?
Company or Account Detail - Search Results
Campaign Detail - Search Results
Person Detail - Search Results
Opportunity Detail - Search Results
How Does CaliberMind Define a "Channel"?
What Is a CaliberMind Event or Event Table?
How to use Dashboards
Connectors / Integrations
CaliberMind Connectors - Start Here!
Overview of Connectors
Adding Your First Connector
CaliberMind Connectors
How to Connect: Act-On
How To Connect: AdRoll / RollWorks
How to Connect: G2, Bombora, or 6sense
How to Connect: Google Ads [via FiveTran]
How To Connect: Google Analytics
How to Connect: Google Sheets
How To Connect: HubSpot
How to Connect: Klaviyo [via FiveTran]
How To Connect: LinkedIn Ads
How To Connect: Marketo
How To Connect: Microsoft Dynamics
How To Connect: Outreach
How to Connect: Pardot [via FiveTran]
How to Connect: Salesforce [via FiveTran]
How to Connect: Segment [via FiveTran]
How to Connect: Twitter [via FiveTran]
How to Connect: ZoomInfo / DiscoverOrg
Kickfire
Setting Up the LinkedIn Push Connector
Setting Up the Salesforce Push Connector
Power BI/ Tableau/ Looker Connectors Article
Connecting Your Data Warehouse to CaliberMind - Start Here!
Connecting Tableau to CaliberMind
CaliberMind Data Export to Google Cloud Storage
Ingesting CaliberMind Data Into Snowflake
Pushing CaliberMind Person Engagement Data to Salesforce
Integrations Appendix by Connector
SFTP Connector - Updated 2021
Replicating CaliberMind Attribution Data to Salesforce
How to Connect Facebook Ads
KickFire De-Anonymization in CaliberMind
Field History SFDC Limits (Salesforce)
SFTP Synced Files - Making a Data Change
Connections - Email Notifications
CaliberMind Data Access FAQs
Microsoft Bing Connector
Bing/Microsoft Ad's Connector
Connector Health and Web Tracker Health reports
Connectors Status Page
In-App Notifications
CaliberMind IP Addresses for Whitelisting
Developer Guide
Developer Guide - Start Here!
CaliberMind Entity Relations and System Tables
What is Google BigQuery
CaliberMind Common Data Sources
CaliberMind Identity Levels
System Configuration
Object Mapping for Filters - Start Here!
Custom Configuration for Object Mapping
Object Mapping Filters
How to Map Your Salesforce Opportunity Revenue Field
Object Mapping: Create a Filter
Object Mapping: Create a Mapping
Object Manager: Campaign Member
Object Mapping: Create a Replacement
Object Mapping: Create a Campaign Substitution
How to See Your Object Manager History and Revert Back to Previous Versions
Setting Your Saved Filters for In-App Reporting
Setting Up UTM Mapping in CaliberMind
UTM Parameters Formatting and Best Practices
Standard Channel Logic
Channel Ranking Logic
Custom SQL Data Transformations
Add BigQuery Users within CaliberMind
Remove a BigQuery User within CaliberMind
Adding Custom Columns in Salesforce
How to Email CaliberMind Reports
Setting Up Account Trend Emails
List Builder
List Builder - Start Here!
What are Lists?
Creating a List Using the List Builder - Step-by-Step Instructions
Use Case Videos - Creating a List Using the List Builder
Importing a List
Downloading a List - Step-by-Step Instructions
Account List Upload - File Requirements
People List Upload - File Requirements
Campaign List Upload - File Requirements
Creating an Account List From a Campaign
Creating Company Lists in List Builder
Creating Company Lists using SQL
How to create a list of all Opportunities that have a very low Engagement
Where is my Segments Menu?
Keyboard Shortcuts using SQL
Web Tracker Installation & Settings
Web Tracker and Installation Settings - Start Here!
Installing AnalyticsJS (CaliberMind snippet)
Two ways to identify prospects that submit a form containing email address using AnalyticsJS
Install AnalyticsJS on a HubSpot website
Using AnalyticsJS Identify on embedded Hubspot forms
Using AnalyticsJS Identify on embedded Marketo forms
Types of Analytics.js Calls
Analytics.JS Overview
Using Analytics.js to Track Web and Product Events
How Cookie Settings Affect the Analytics.JS Tracking Script
Google Tag Manager (GTM) Ad Blockers
Using AnalyticsJS with Drift
Using AnalyticsJS with Qualified
How to check your AnalyticsJS implementation
Identify users using Intercom Messenger
Flows
CaliberMind's Most Popular Flows | Automations
How to use QuickFlows
Flows Status Page
Merge records in Salesforce CRM
Add a Quick-Flow to Salesforce Campaign
Using ClearBit Flows
Setting Up Workflow - Lead Deduplication
ZoomInfo - Add-to/Enrich your database
Setting Up Workflow - Website Repair
Setting Up Workflow - Account Deduplication
Creating Sales Campaigns from Salesloft and Outreach Activities
Setting Up Workflow - Contact Deduplication
Campaigns
Campaigns - Start Here!
Custom Programs for Campaigns
Campaign-Program Membership
Custom Campaigns
Program Logic for Campaigns
Setting Up Answers
Setting Up Answers - Start Here!
Using CaliberMind Answers to Understand Campaign Performance
Using CaliberMind Answers to Understand Account Engagement
Using CaliberMind Answers to Understand Funnel Performance
Using CaliberMind Answers to Understand Funnel Impact
Using CaliberMind Answers to Understand Funnel Flow
User Administration & SSO
Administration and SSO - Start Here!
Single Sign On (SSO) Setup
Manage Users - Viewing, Inviting, Updating Users and Roles
User Authentication and Provisioning
CaliberMind Data Warehouse Access in Google BigQuery
CaliberMind Insights Dashboards
Working in Insights
CaliberMind Insights - Browser Requirements
CaliberMind Insights - Sharing Dashboards & User Permissions
CaliberMind Insights - Navigating to Insights/Dashboard
CaliberMind Insights - Using Dashboards
CaliberMind Insights - Dashboard Refresh Schedule
CaliberMind Insights - Application Concepts and Terminology
CaliberMind Insights - Filters & Aggregation Type
Building Dashboards - Insights
Attribution Dashboards - Insights
Insights - Attribution - Start Here!
Insights - Attribution Terminology and Key Concepts
Insights - Attribution Overview Dashboard 2.0
Engagement Dashboards - Insights
Insights - Engagement - Start Here!
Insights - Engagement - Dashboard Terminology & Key Concepts
Insights - Engagement Overview
Insights - Engagement - System Account Detail
Insights - Engagement - Person Detail
Build Insights Dashboards - Start Here!
Creating a Custom Pipeline Dashboard (VIDEO)
CaliberMind Insights - Creating Custom Dashboards
Build Your Own Insights Pipeline Dashboard
Building Formulas with Functions
Insights - ROAS Dashboard Use Cases
Creating and Editing a Widget Formula
Using Conditional Statements
How is CaliberMind ROAS Reporting Different than Insights ROI?
Insights - ROI - Start Here!
How to Create a Filter Bookmark
Create Date Range Filters - Step-by-Step
Creating Formulas Based on Criteria and Conditions (Filters)
Insights Data Connector Health Dashboard
Dashboard Function Reference
Introduction to Formulas - Start Here!
Insights Web Tracker Health Dashboard
Using Quick Functions
Insights - ROAS Terminology & Key Concepts
Insights Engagement Dashboard - Aggregation Dates
CaliberMind Sandbox
GDPR Compliance with CaliberMind
Data Dictionary
Attribution
Analytics
Attribution
Attribution Overview: Summary Tab
Attribution Overview: Comparisons Tab
Attribution Overview: Explore Tab
Attribution Overview: Opps Tab
Attribution Overview: People Tab
Attribution Overview: Events Tab
Campaign Types: Best Practices for Easy-to-Read Attribution
Virtual Campaigns in CaliberMind
Attribution - CaliberMind versus Embedded Attribution in Salesforce?
Removal effect with a Markov chain model
Attribution Reports Summary
Demand Generation
Data Integrity
Customer Success
Understanding Reports
CaliberMind Analytics Concepts
Overview of Analytics and Attribution
Filters and Hyperlinks
Using the Engagement Trending Report
Analytics Reporting: Salesforce Custom Column Filter Support
Using Tags to Organize Your Lists
Attribution Overview - Campaign Performance Table
Using Campaign Lists in Dashboards
Using Company Lists in Dashboards
CaliberMind Metrics Definition
Product Attribution Dashboard
Self-Hosting CaliberMind AnalyticsJS
ROI
Revolutionizing Marketing ROI: CaliberMind's Innovative New Approach
Return On Ad Spend Dashboards
Revenue Contribution Reports Summary
Channel ROI Overview
Creating and maintaining a custom advertising budget for ROAS
Best Practices for Tracking Return-on-Ad-Spend (ROAS)
Why Is CaliberMind ROAS or ROI Different Than My Ad Platform?
Campaign ROI Overview
Budget for ROI Channel Reporting
Attribution Models
Funnels
Funnels 101
Funnels - Start Here!
Marketing & Sales Funnel Foundations
What is a Marketing Funnel?
Sales Funnel Journey: Questions and Answers
Common Funnel Issues
Sales Funnel Glossary
Funnel Stage Definitions
Funnel Terms and Concepts
What is the difference between an Active Journey and a Journey?
In-App Funnels
Funnel Overview: Summary Tab
Funnel Overview: Progression Tab
Funnel Overview: Cohort Tab
Funnel Overview: Stage Analyzer Tab
Funnel Overview: Comparison Tab
Funnel Overview: Journeys Tab
Insights Funnels
Funnel Stages Configuration and Stage Definitions
Funnel Configuration
Funnels FAQs Technical Documentation
Funnel Trigger Events Dashboard
Funnel Company Inclusion Configuration
Event Explore for Funnels
Funnel History Event Configuration
What channels move journeys through a given stage?
Funnel Trend Dashboard
How can I see the number of journeys in or passing through a funnel stage during a period of time?
Sales Funnel Metrics
What touches are influencing each step in the funnel?
How do I see the first event (or "tipping point") in each stage of my funnel?
Funnel Events Technical Documentation
Funnel Static Event Configuration
What is a Starter Funnel?
Funnel Person Inclusion Configuration
Funnel Cohort Analysis Dashboard
Where are my customers stuck in journeys?
Funnel Cohort Analysis Use Cases
Funnel Data Explore Dashboard
Use Cases for Funnels
How do I know the last event that happened before a journey stage change?
How do I identify stage conversion rates?
Funnel Person Status Exits
Introducing CaliberMind's Funnels
Funnels - Lead, Contact, Account, Opportunity Statuses and Stages
Pressure Event Dashboard 101
Demand Generation Funnel Dashboard
Engagement and ABM
Engagement Scoring
Model Configuration
Customize Engagement Scoring Models - Start Here!
Engagement Scoring Models Overview
How to Change Event Touch Scores
How to Add or Change Engagement Score Multipliers
Add or Change Engagement Score Filters
Create Multiple Engagement Score Models
Which touches and events are we scoring?
Sales Opportunity Data Model
Engagement Scoring Time Decay - How It Works & How to Change It
Custom Attribution Configuration - Custom Weighting
Using Engagement Score to Trigger an Update in Salesforce
Default ABM Scoring Logic
Engagement Reporting
Engagement: Summary Tab
Engagement Overview: Companies Tab
Engagement Overview: People Tab
Engagement Overview: Campaigns Tab
Engagement Overview: Explore Tab
Company Engagement AI Summary
Account-Based Marketing Reports
Linking to CaliberMind Reports in Salesforce
ABM Best Practices
Account-to-Lead (A2L) Matching
Lead-to-Account Matching (L2A)
Pushing CaliberMind ABM Scoring Fields to Salesforce.com
3rd Party Intent Signals with Bombora
Tutorials and Use Cases
Digital Marketing Terminology
Customizing Report Visibility (Show/Hide)
How to Manage Your Offsite Events Using CaliberMind
How can I manage my BDR/SDR team activities with CaliberMind?
Combining Engagement Score with Attribution
Enabling the Sales Teams to see the Entire Buyers Journey
How Can I Identify High Risk Opportunities?
How does Sales leverage CaliberMind? Some key use cases.
Running a Sales/Pipeline Review with CaliberMind
How Is CaliberMind Different From My CRM Attribution?
CRM Campaign Member Status and Campaign Response Best Practices
How Do I Optimize Advertising Spend?
Campaign Best Practices Across Systems
How do I use CaliberMind to shorten our sales cycle?
Answering Business Questions Using CaliberMind Reports
Which of my leads are the most engaged?
How Do I Know If a Campaign Is Good or Bad?
How to Flatten Your Campaign Structure in Salesforce
Table of Contents
- All Categories
- Funnels
- Insights Funnels
- How do I see the first event (or "tipping point") in each stage of my funnel?
How do I see the first event (or "tipping point") in each stage of my funnel?
How do I see the first event (or "tipping point") in each stage of my funnel?
The Importance of Performance Measurement
Your website is great, your content is great, and you're executing a thoughtful marketing strategy... yet... you know in your gut that your conversion rates are sub-optimal. Solving this problem can be difficult and frustrating.
Diagnostics begin with a good understanding of your business's marketing funnel. Getting the right message to the right people at the right time is the goal of any marketing strategy. Despite being one of the most basic marketing elements, it's also one of the most important. In marketing, it drives everything from social media campaigns to product demonstrations.
Evaluating the impact is a key component of every marketing campaign. If you understand the success metrics that matter to your marketing campaign, you can calculate your overall return on investment. Identifying your marketing goal is the first step in understanding how your campaign performed.
This article will discuss how to find the "tipping point" of each stage of your funnel. By looking at what caused each stage to be reached, we can identify trends and correlations that will give us a better understanding of which strategies are working and which ones need to be adjusted. This will allow us to identify where we should focus our efforts to increase conversions.
What steps would you take to view the most common (or “tipping point”) events?
- Go to the dashboard Funnel Trigger Events
- Select the Stage you would like to evaluate under Stage Selection.
- Click the Event Type tab at the top of the stacked chart
- View the Event Type Table
- Sort the table Descending (Z-A)
- View the table data
Interactive Step-by-Step
The Deeper Dive
View the table data
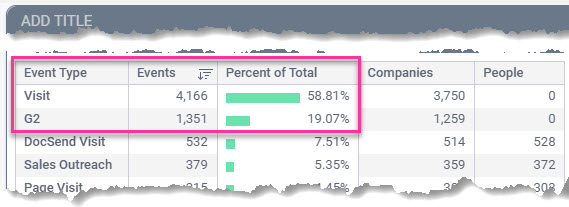
Visit - The most common event indicates the first (and most common) event at triggering people to enter the selected stage. But don’t stop there. It’s a good idea to view the most common event in each stage of the funnel because they are dramatically different.
G2 - The 2nd highest numbered event showing on the table is G2 for CaliberMind's 01: Is inbound stage.
We’ll analyze both of these results below.
Deeper Dive in Context
Context - The highest weeks or months of activities are something we should note and compare to initiatives that would drive a higher volume of those event types at that time. For example, when there are spikes in page visits, did we change our advertising strategy or release any PR? Let's take a look at the findings and the strategic pivots that are made based upon those findings.
Visit Analysis - Initially, page visit increases corresponded to increased advertising spend. Then a dip happened when we changed our website CMS (content management system or platform it's built on) and decreased advertising efforts. What's more important to note is conversion rates compared to the volume of visitors went up dramatically after this change. This means that our advertising was inefficient and drawing in the wrong crowd - and we gained more meaningful interactions with our website by improving the user experience.
Strategic Pivot based upon findings - Thinking this through, we see that although we increased traffic, it wasn't the traffic we wanted to see come through. Thus we went back to the drawing board and refined our outreach strategy to define and refine our advertising targeting.
Questions that arose in our meeting -
Why are there 'anonymous' people represented in G2 or in Visits?
G2 doesn't provide person data for privacy reasons. Like most intent providers, they only provide data at the account level.
The reason why you see mostly (there are a few people) accounts in web data is because we have Clearbit Reveal and are only usually able to de-anonymize at the company and not the person level.
What caused the spike in G2?
G2 wasn't due to marketing efforts. Not sure what did that. We speculate that there could be an increase in customer reviews but likely reflective of people planning their 2023 budget. That lines up with fiscal planning.