System Overview
Getting Started
New to CaliberMind - Start Here!
How do I use CaliberMind's search functionality?
Company or Account Detail - Search Results
Campaign Detail - Search Results
Person Detail - Search Results
Opportunity Detail - Search Results
How Does CaliberMind Define a "Channel"?
What Is a CaliberMind Event or Event Table?
How to use Dashboards
CaliberMind Home Page - Updated
Quick Link Bookmarks
Connectors / Integrations
CaliberMind Connectors - Start Here!
Adding Your First Connector
CaliberMind Connectors
How to Connect: Act-On
How To Connect: AdRoll / RollWorks
How to Connect: G2, Bombora, or 6sense
How to Connect: Google Ads [via FiveTran]
How To Connect: Google Analytics
How to Connect: Google Sheets
How To Connect: HubSpot
How to Connect: Klaviyo [via FiveTran]
How To Connect: LinkedIn Ads
How To Connect: Marketo
How To Connect: Microsoft Dynamics
How To Connect: Outreach
How to Connect: Pardot [via FiveTran]
How to Connect: Salesforce [via FiveTran]
How to Connect: Segment [via FiveTran]
How to Connect: Twitter [via FiveTran]
How to Connect: ZoomInfo / DiscoverOrg
How To Connect: Google Campaign Manager 360
Kickfire
Setting Up the LinkedIn Push Connector
Setting Up the Salesforce Push Connector
How to Connect: Slack
Power BI/ Tableau/ Looker Connectors Article
Connecting Your Data Warehouse to CaliberMind - Start Here!
Connecting Tableau to CaliberMind
CaliberMind Data Export to Google Cloud Storage
Ingesting CaliberMind Data Into Snowflake
Pushing CaliberMind Person Engagement Data to Salesforce
Integrations Appendix by Connector
SFTP Connector - Updated 2021
Replicating CaliberMind Attribution Data to Salesforce
How to Connect Facebook Ads
How To Connect: Google Search Ads 360
KickFire De-Anonymization in CaliberMind
Field History SFDC Limits (Salesforce)
SFTP Synced Files - Making a Data Change
Connections - Email Notifications
CaliberMind Data Access FAQs
Microsoft Bing Connector [via FiveTran]
Connector Health and Web Tracker Health reports
Connectors Status Page
In-App Notifications
CaliberMind IP Addresses for Whitelisting
Developer Guide
Developer Guide - Start Here!
CaliberMind Entity Relations and System Tables
What is Google BigQuery
CaliberMind Common Data Sources
CaliberMind Identity Levels
System Configuration
Configuring Funnels
How to Set Up and Configure Funnels
Funnel Stages Configuration and Stage Definitions
Funnels FAQs Technical Documentation
Funnel Company Inclusion Configuration
Event Explore for Funnels
Funnel History Event Configuration
Funnel Static Event Configuration
Funnel Person Inclusion Configuration
Funnel Person Status Exits
Object Manager: Campaign Member
How to See Your Object Manager History and Revert Back to Previous Versions
Setting Your Saved Filters for In-App Reporting
Setting Up UTM Mapping in CaliberMind
UTM Parameters Formatting and Best Practices
Standard Channel Logic
Channel Ranking Logic
Custom SQL Data Transformations
Add BigQuery Users within CaliberMind
Remove a BigQuery User within CaliberMind
Adding Custom Columns in Salesforce
How to Email CaliberMind Reports
Setting Up Account Trend Emails
How does CaliberMind normalize the raw data for use?
List Builder
List Builder - Start Here!
What are Lists?
Creating a List Using the List Builder - Step-by-Step Instructions
Use Case Videos - Creating a List Using the List Builder
Importing a List
Downloading a List - Step-by-Step Instructions
Account List Upload - File Requirements
People List Upload - File Requirements
Campaign List Upload - File Requirements
Creating an Account List From a Campaign
Creating Company Lists in List Builder
Creating Company Lists using SQL
How to create a list of all Opportunities that have a very low Engagement
Where is my Segments Menu?
Keyboard Shortcuts using SQL
Web Tracker Installation & Settings
Web Tracker and Installation Settings - Start Here!
Installing AnalyticsJS (CaliberMind snippet)
Two ways to identify prospects that submit a form containing email address using AnalyticsJS
Install AnalyticsJS on a HubSpot website
Using AnalyticsJS Identify on embedded Hubspot forms
Using AnalyticsJS Identify on embedded Marketo forms
Types of Analytics.js Calls
Analytics.JS Overview
Using Analytics.js to Track Web and Product Events
How Cookie Settings Affect the Analytics.JS Tracking Script
Google Tag Manager (GTM) Ad Blockers
Using AnalyticsJS with Drift
Using AnalyticsJS with Qualified
How to check your AnalyticsJS implementation
Identify users using Intercom Messenger
Flows
CaliberMind's Most Popular Flows | Automations
How to use QuickFlows
Flows Status Page
Merge records in Salesforce CRM
Add a Quick-Flow to Salesforce Campaign
Using ClearBit Flows
Setting Up Workflow - Lead Deduplication
ZoomInfo - Add-to/Enrich your database
Setting Up Workflow - Website Repair
Setting Up Workflow - Account Deduplication
Creating Sales Campaigns from Salesloft and Outreach Activities
Setting Up Workflow - Contact Deduplication
Campaigns
Campaigns - Start Here!
Custom Programs for Campaigns
Campaign-Program Membership
Custom Campaigns
Program Logic for Campaigns
Setting Up Answers
Setting Up Answers - Start Here!
Using CaliberMind Answers to Understand Campaign Performance
Using CaliberMind Answers to Understand Account Engagement
Using CaliberMind Answers to Understand Funnel Performance
Using CaliberMind Answers to Understand Funnel Impact
Using CaliberMind Answers to Understand Funnel Flow
Ask Cal Custom AI Answer
Ask Cal Custom Answers: Use Cases
User Administration & SSO
Administration and SSO - Start Here!
Single Sign On (SSO) Setup
Manage Users - Viewing, Inviting, Updating Users and Roles
User Authentication and Provisioning
CaliberMind Data Warehouse Access in Google BigQuery
CaliberMind Insights Dashboards
Working in Insights
CaliberMind Insights - Browser Requirements
CaliberMind Insights - Sharing Dashboards & User Permissions
CaliberMind Insights - Navigating to Insights/Dashboard
CaliberMind Insights - Using Dashboards
CaliberMind Insights - Dashboard Refresh Schedule
CaliberMind Insights - Application Concepts and Terminology
CaliberMind Insights - Filters & Aggregation Type
Building Dashboards - Insights
Attribution Dashboards - Insights
Insights - Attribution - Start Here!
Insights - Attribution Terminology and Key Concepts
Insights - Attribution Overview Dashboard 2.0
Engagement Dashboards - Insights
Insights - Engagement - Start Here!
Insights - Engagement - Dashboard Terminology & Key Concepts
Insights - Engagement Overview
Insights - Engagement - System Account Detail
Insights - Engagement - Person Detail
Build Insights Dashboards - Start Here!
Creating a Custom Pipeline Dashboard (VIDEO)
CaliberMind Insights - Creating Custom Dashboards
Build Your Own Insights Pipeline Dashboard
Building Formulas with Functions
Insights - ROAS Dashboard Use Cases
Creating and Editing a Widget Formula
Using Conditional Statements
How is CaliberMind ROAS Reporting Different than Insights ROI?
Insights - ROI - Start Here!
How to Create a Filter Bookmark
Create Date Range Filters - Step-by-Step
Creating Formulas Based on Criteria and Conditions (Filters)
Insights Data Connector Health Dashboard
Dashboard Function Reference
Introduction to Formulas - Start Here!
Insights Web Tracker Health Dashboard
Using Quick Functions
Insights - ROAS Terminology & Key Concepts
Insights Engagement Dashboard - Aggregation Dates
Filters
Object Mapping for Filters - Start Here!
Custom Configuration for Object Mapping
Object Mapping Filters
How to Map Your Salesforce Opportunity Revenue Field
Object Mapping: Create a Filter
Object Mapping: Create a Mapping
Object Mapping: Create a Replacement
Object Mapping: Create a Campaign Substitution
Filters Update for Creating Filter Sets
Filter Drawer Definitions
CaliberMind Sandbox
GDPR Compliance with CaliberMind
Data Dictionary
Attribution
Analytics
Attribution
Attribution Overview: Summary Tab
Attribution Overview: Comparisons Tab
Attribution Overview: Explore Tab
Attribution Overview: Opps Tab
Attribution Overview: People Tab
Attribution Overview: Events Tab
Campaign Types: Best Practices for Easy-to-Read Attribution
Virtual Campaigns in CaliberMind
Attribution - CaliberMind versus Embedded Attribution in Salesforce?
Removal effect with a Markov chain model
Attribution Reports Summary
Demand Generation
Data Integrity
Customer Success
Understanding Reports
CaliberMind Analytics Concepts
Overview of Analytics and Attribution
Filters and Hyperlinks
Using the Engagement Trending Report
Analytics Reporting: Salesforce Custom Column Filter Support
Using Tags to Organize Your Lists
Attribution Overview - Campaign Performance Table
Using Campaign Lists in Dashboards
Using Company Lists in Dashboards
CaliberMind Metrics Definition
Product Attribution Dashboard
Self-Hosting CaliberMind AnalyticsJS
ROI
Revolutionizing Marketing ROI: CaliberMind's Innovative New Approach
Return On Ad Spend Dashboards
Revenue Contribution Reports Summary
Channel ROI Overview
Creating and maintaining a custom advertising budget for ROAS
Best Practices for Tracking Return-on-Ad-Spend (ROAS)
Why Is CaliberMind ROAS or ROI Different Than My Ad Platform?
Campaign ROI Overview
Budget for ROI Channel Reporting
Attribution Models
Choosing the Right Attribution Model
Attribution Models: First-Touch
Attribution Models: W-Shaped
Attribution Models: Middle
Chain-Based Attribution Model
The A-Shaped Model
Configurable Widgets
Ad Performance Report - Summary Tab
Ad Performance Report - Attribution Tab
Funnels
Funnels 101
Funnels - Start Here!
Marketing & Sales Funnel Foundations
What is a Marketing Funnel?
Sales Funnel Journey: Questions and Answers
Common Funnel Issues
Sales Funnel Glossary
Funnel Stage Definitions
Funnel Terms and Concepts
Sales Funnel Metrics
What is the difference between an Active Journey and a Journey?
In-App Funnels
Funnel Overview: Summary Tab
Funnel Overview: Progression Tab
Funnel Overview: Cohort Tab
Funnel Overview: Stage Analyzer Tab
Funnel Overview: Comparison Tab
Funnel Overview: Journeys Tab
Insights Funnels
Funnels Use Cases
What channels move journeys through a given stage?
How can I see the number of journeys in or passing through a funnel stage during a period of time?
What touches are influencing each step in the funnel?
How do I see the first event (or "tipping point") in each stage of my funnel?
Where are my customers stuck in journeys?
How do I know the last event that happened before a journey stage change?
How do I identify stage conversion rates?
Funnel Configuration - Insights
Funnel Trigger Events Dashboard
Insights Funnels Reports Explained
Funnel Trend Dashboard
What is a Starter Funnel?
Funnel Cohort Analysis Dashboard
Funnel Cohort Analysis Use Cases
Funnel Data Explore Dashboard
Introducing CaliberMind's Funnels
Funnels - Lead, Contact, Account, Opportunity Statuses and Stages
Pressure Event Dashboard 101
Demand Generation Funnel Dashboard
Engagement and ABM
Engagement Scoring
Model Configuration
Customize Engagement Scoring Models - Start Here!
Engagement Scoring Models Overview
How to Change Event Touch Scores
How to Add or Change Engagement Score Multipliers
Add or Change Engagement Score Filters
Create Multiple Engagement Score Models
Which touches and events are we scoring?
Sales Opportunity Data Model
Engagement Scoring Time Decay - How It Works & How to Change It
Custom Attribution Configuration - Custom Weighting
Using Engagement Score to Trigger an Update in Salesforce
Default ABM Scoring Logic
Recommended Weights for Engagement Scores
Engagement Reporting
Engagement: Summary Tab
Engagement Overview: Companies Tab
Engagement Overview: People Tab
Engagement Overview: Campaigns Tab
Engagement Overview: Explore Tab
Company Engagement AI Summary
Account-Based Marketing Reports
Linking to CaliberMind Reports in Salesforce
ABM Best Practices
Account-to-Lead (A2L) Matching
Lead-to-Account Matching (L2A)
Pushing CaliberMind ABM Scoring Fields to Salesforce.com
Slack AI Company Engagement Summary
3rd Party Intent Signals with Bombora
Tutorials and Use Cases
Digital Marketing Terminology
Customizing Report Visibility (Show/Hide)
How to Manage Your Offsite Events Using CaliberMind
How can I manage my BDR/SDR team activities with CaliberMind?
Combining Engagement Score with Attribution
Enabling the Sales Teams to see the Entire Buyers Journey
How Can I Identify High Risk Opportunities?
How does Sales leverage CaliberMind? Some key use cases.
Running a Sales/Pipeline Review with CaliberMind
How Is CaliberMind Different From My CRM Attribution?
CRM Campaign Member Status and Campaign Response Best Practices
How Do I Optimize Advertising Spend?
Campaign Best Practices Across Systems
How do I use CaliberMind to shorten our sales cycle?
Answering Business Questions Using CaliberMind Reports
Which of my leads are the most engaged?
How Do I Know If a Campaign Is Good or Bad?
How to Flatten Your Campaign Structure in Salesforce
Table of Contents
- All Categories
- Attribution
- ROI
- Channel ROI Overview
Channel ROI Overview
 Updated
by Matt Mackenzie
Updated
by Matt Mackenzie
ROI Overview - Channel
The Channel ROI Dashboard shows spend impact on attributable pipeline (Total Attribution) and won pipeline (Bookings) for defined channels set in the CM Attribution Budgets. The report will aggregate channel touches to the touch date and tie channel spend into the same period. Filtering can be done across Company, Opportunity and Person level features. This allows you to see the effect of your marketing spend on specific account lists or segmenting by opportunity type. This report gives a Top-Down ROI view that helps marketers decide where to spend their next dollar.
The summary KPIs atop this report are provided for both the Channel and Campaigns Tabs. Cost Data will differ. The Channel costs come from the budget entry in settings where as Campaign costs originate from Salesforce and the various ad platforms connected. Since Cost is different the corresponding ROI numbers will also be different. Campaigns usually do not have a 1:1 relationship with Channels, so if filtering is applied attribution and bookings results may differ.
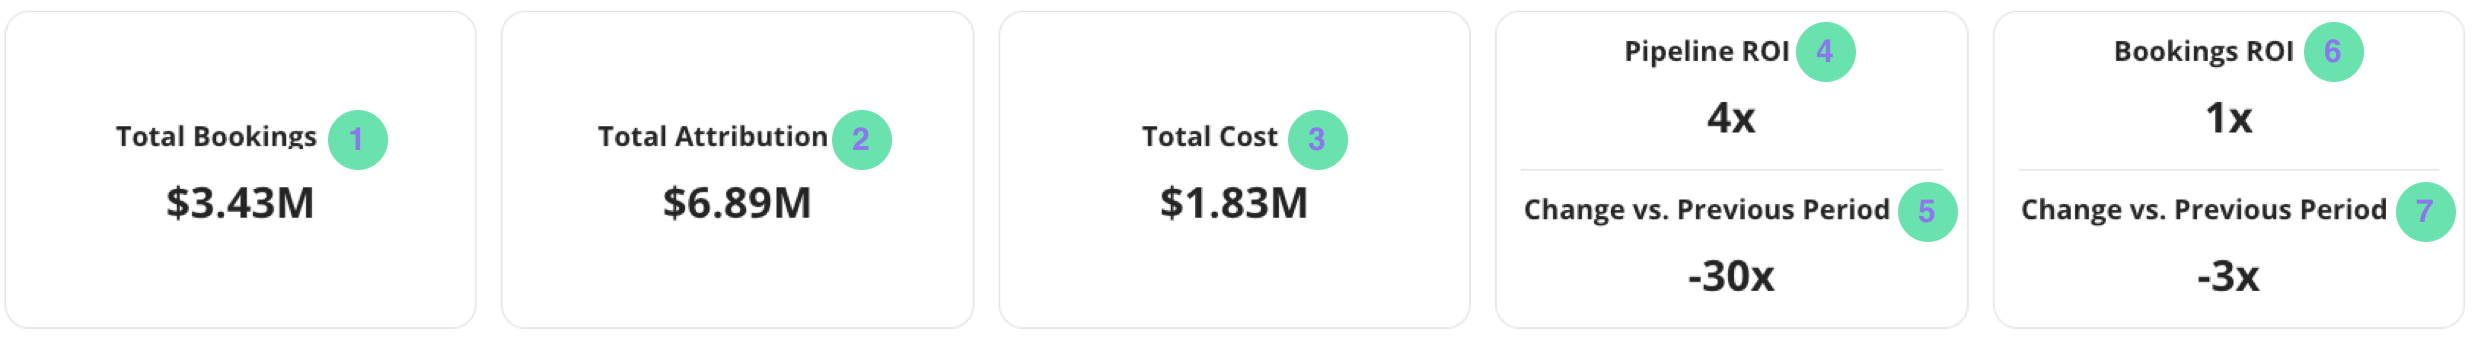
- Total Bookings - total touch value tied to closed won pipeline for the date period selected.
- Total Attribution - total touch value tied to pipeline for the date period selected.
- Total Cost - displays the total amount of Cost entered for each Channel over the time period selected
- Attributed Pipeline ROI - this metric is a multiplier which tells you how much attribution (attributed pipeline) dollars you get back for every dollar you spent. The math is total attributed pipeline divided by the total cost. For example: If you spent $1,000 on campaigns two quarters ago and created 500 campaign touches that were assigned $5,000 in attribution within your look-ahead window, you would have a Pipeline ROI of 5x for that time period.
- Change vs. Previous Period (Pipeline) - displays the absolute change in the pipeline ROI metric comparing the current period to the previous period. For example if you select a date range of the prior quarter, and pipeline ROI was 15 in the prior quarter, but was 20 two quarters ago the absolute change would be -5x.
- Attributed Bookings ROI - this metric is a multiplier which tells you how many dollars in attributed bookings (attributed dollars from opps that are closed won) you get back for every dollar you spent. The math is total attributed bookings divided by the total cost. For example: If you spent $1,000 on campaigns two quarters ago and created 500 campaign touches that were assigned $5,000 in attribution within your look-ahead window, and of that $5,000, $3,000 were attributed to opps that are closed won you would have a Pipeline ROI of 3x for that time period.
- Change vs. Previous Period (Bookings) - displays the absolute change in the bookings ROI metric comparing the current period to the previous period. For example if you select a date range of the prior quarter, and booking ROI was 3x in the prior quarter, but was 5x two quarters ago the absolute change would be -2x.
Total Bookings Attributed by Channel Heat Map
This widget allows the user to see Return on Investment based on a dynamic metric by Channel. By default we will be showing by Attributed Booking ROI by Channel. A core problem with comparing ROI values over time is the need to have a fixed time horizon. In ROI calculations, cost is realized immediately (e.g. you spent money in Jan) but value is realized over time as things mature (e.g. you spend the money in Jan and it generated bookings in March). In order to be able to compare across time, we allow you to set a “Look-ahead Period.” This means that a value of 30 would be equivalent to saying “I’m comparing time periods based on the amount of value they generate within 30 days of their touch.”
The period which is considered locked will display with a brighter color set, the unlocked period will be a more muted version of those colors. By setting a shorter look-ahead period, you are able to shorten the feedback loop, will have fewer “unlocked” pieces of data, that can’t be fairly compared.
However, this comes at a cost of reducing the amount attribution and ultimately bookings that will be counted. A longer look ahead window will give you a more accurate number, but lengthens the feedback loop to comparing performance over time. To effectively disable the look-ahead window and see all attribution, set the window to 999. By default, CaliberMind caps attribution with a 365 day window which means all attribution should be counted.
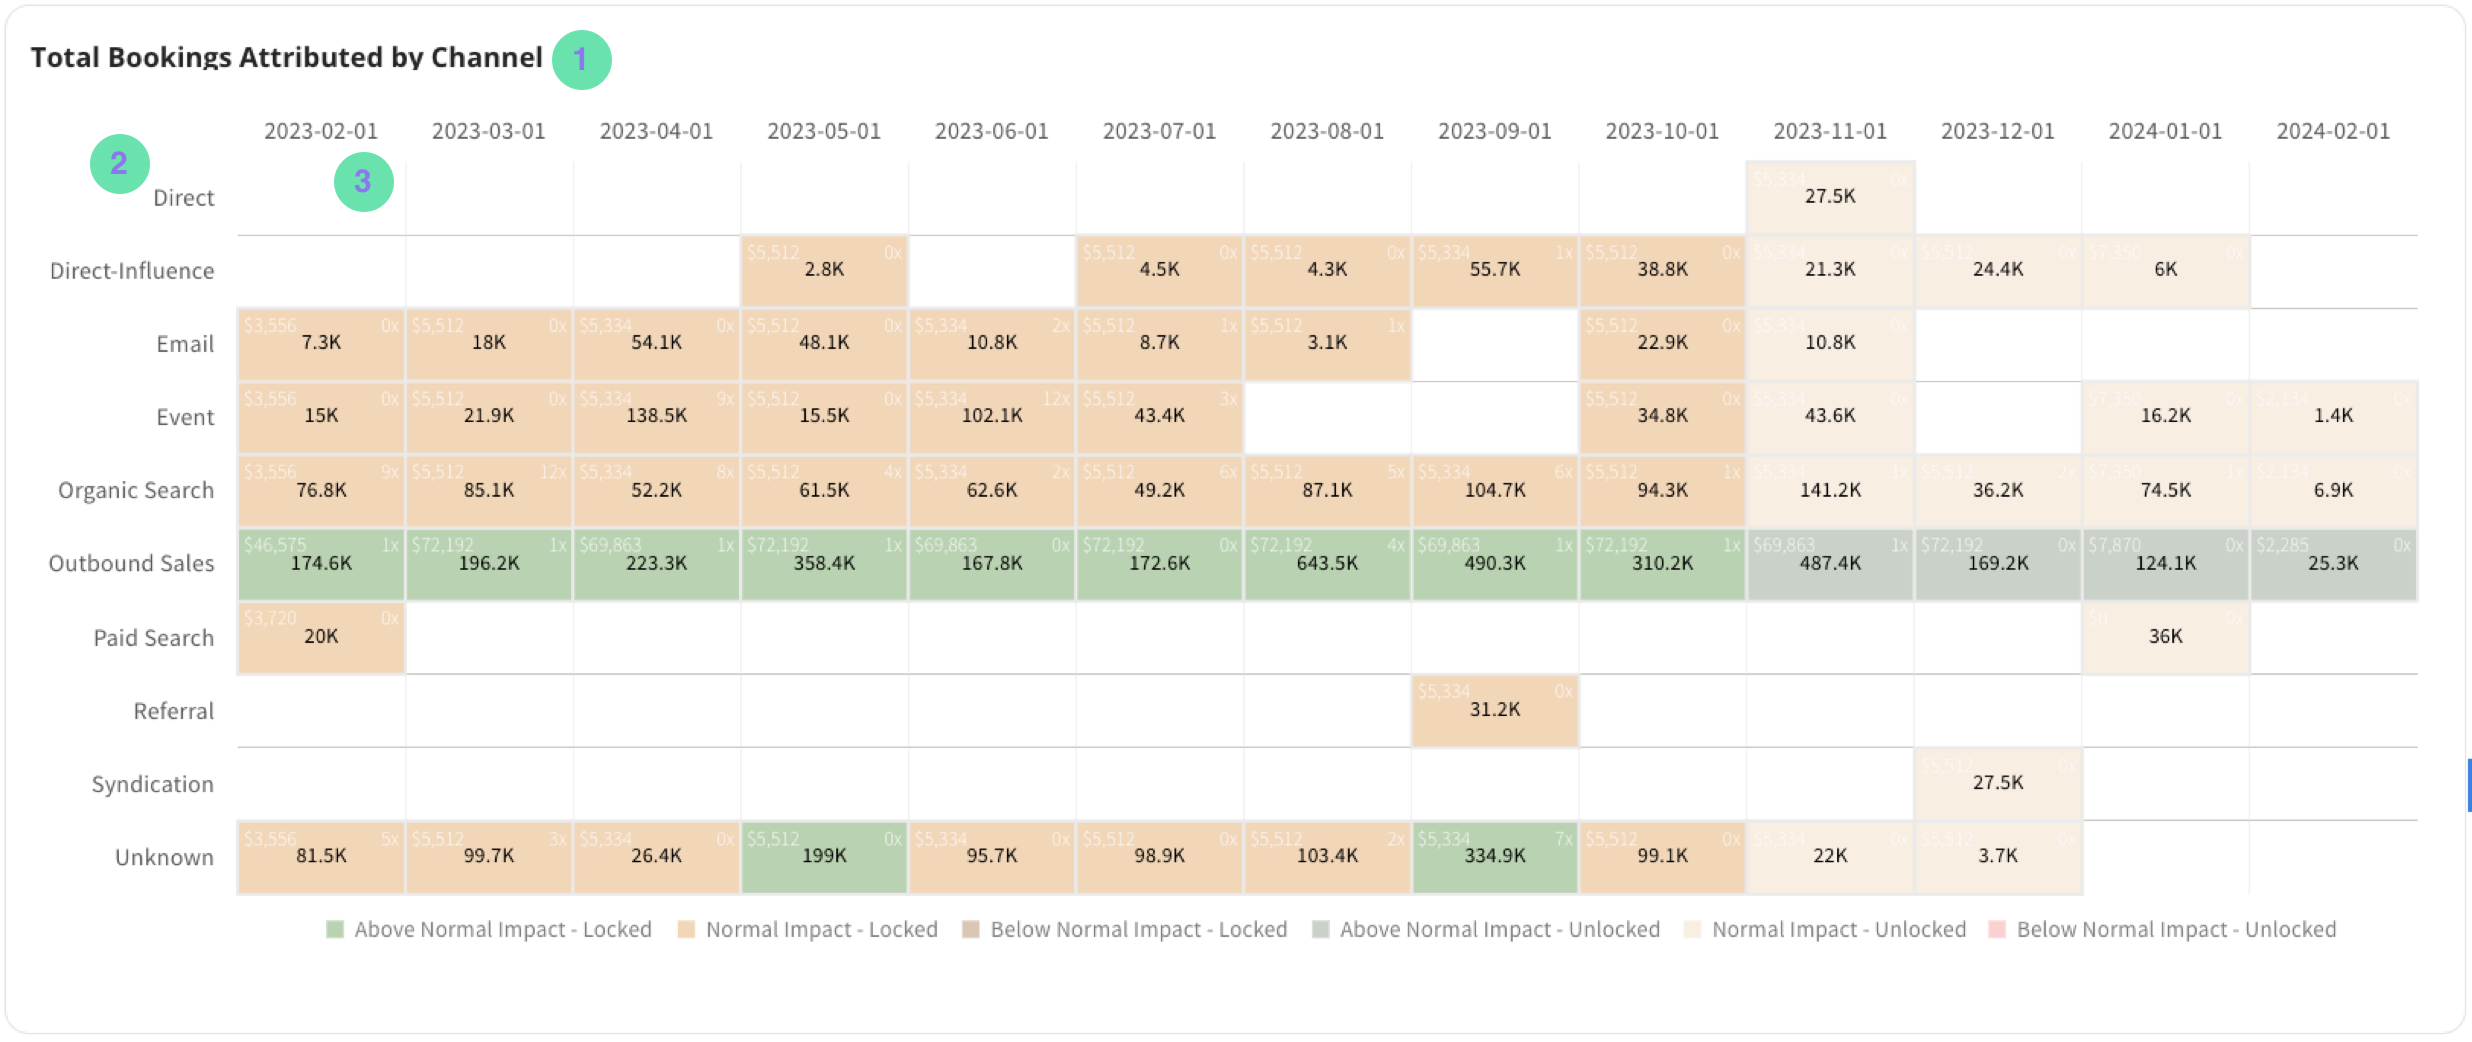
- Total Bookings Attributed by Channel - this widget breaks out each channel and allows you to see different metrics laid out in this Heat Map visualization. Options are: Pipeline ROI, Bookings ROI, Total Bookings Attributed, Total Pipeline Attributed, Cost.
- The Y-axis shows your configured Channels
- The x-axis shows time.
Heatmap colors are determined by looking at standard deviations across columns (IE all non null values in any given column are used to calculate standard deviations for determining color coding within that specific column. The threshold for above or below average is set at 1 standard deviation away.
Channel Detail Table Widget
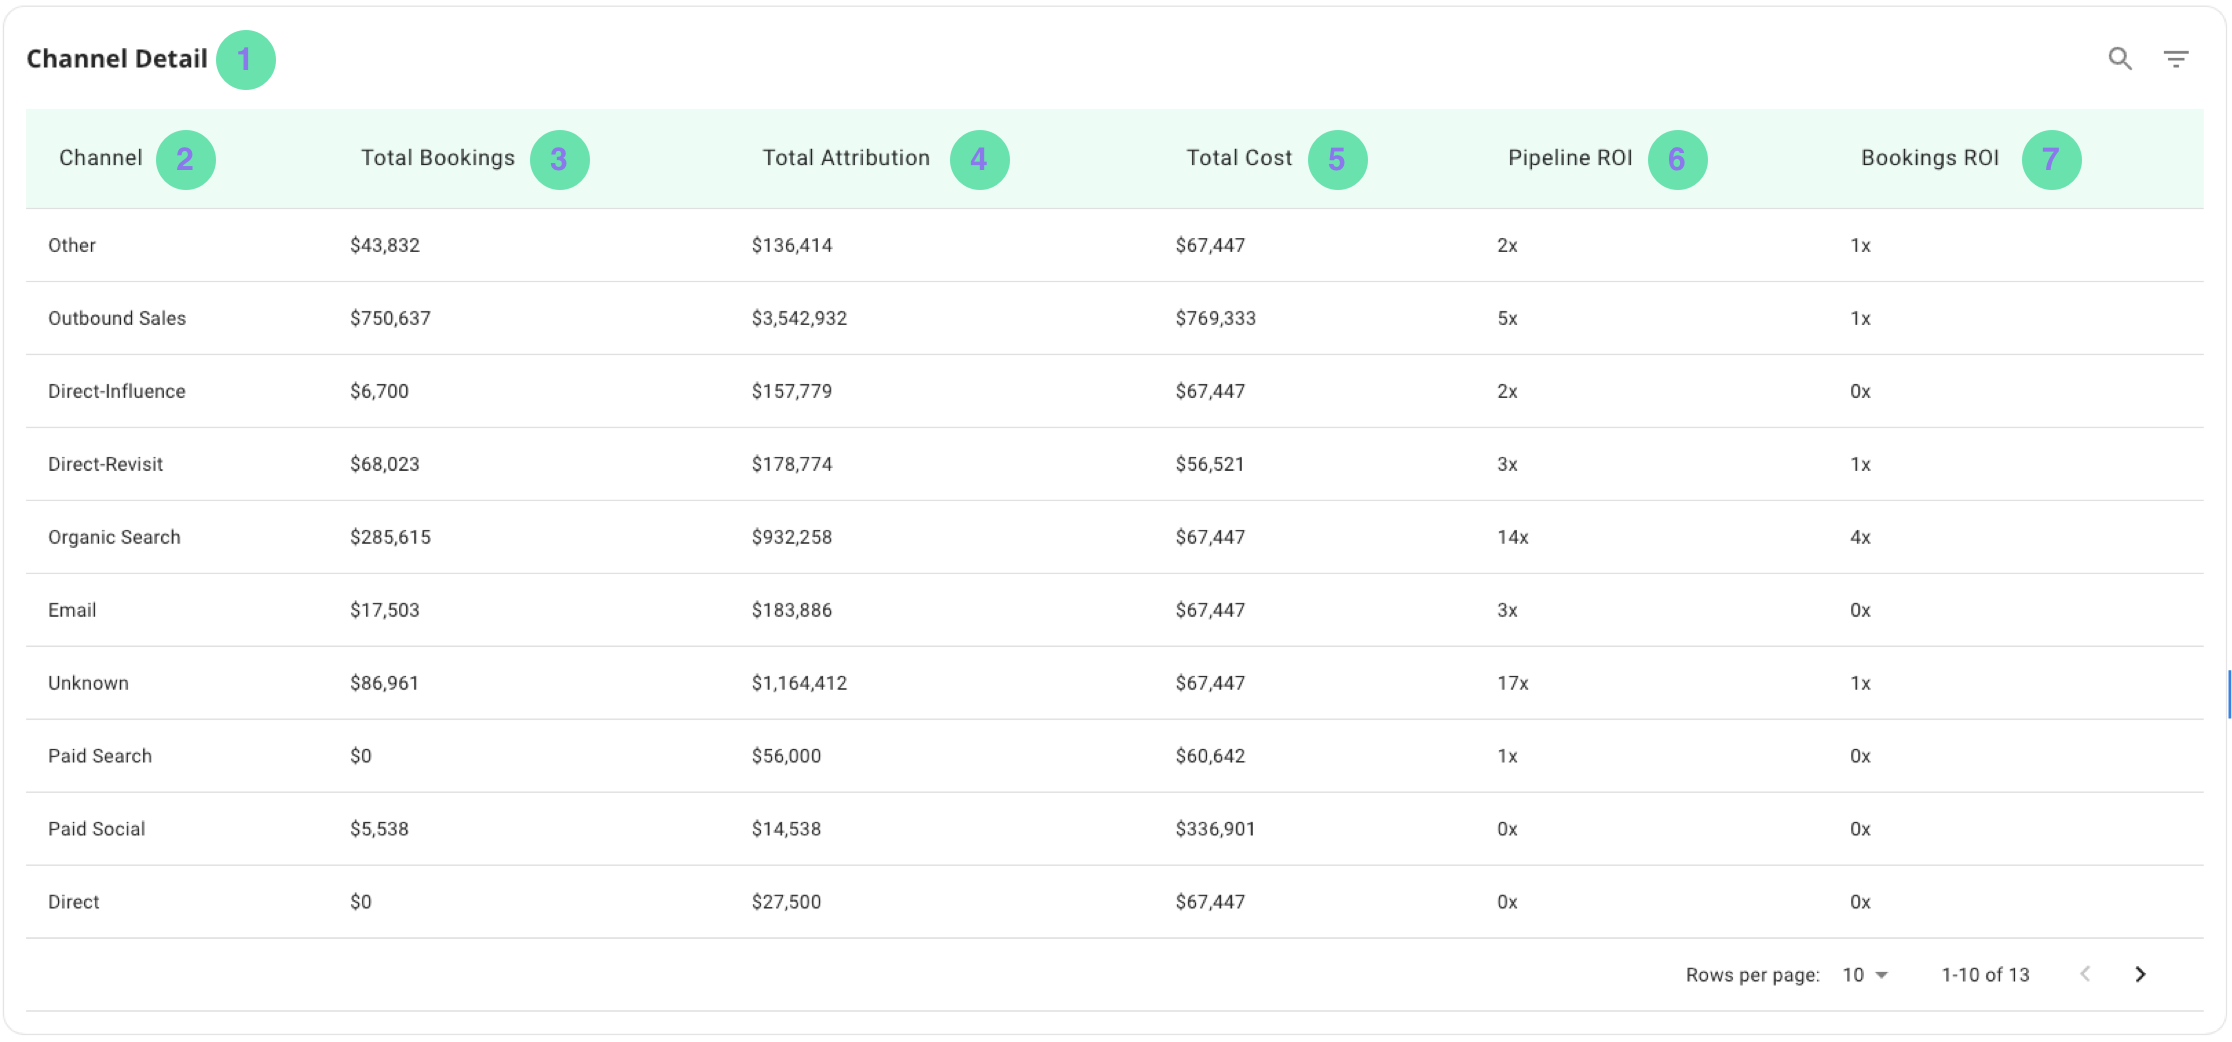
- Channel Detail - this widget shows metrics for all Channels configured in your system.
- Channel - this column contains all configured Channels in your system
- Total Bookings - displays the total dollar amount of Closed Won Opportunities based on the filters currently applied.
- Total Attribution - displays the total dollar amount of Pipeline Attribution generated based on the filters currently applied
- Total Cost - displays the sum amount of budget entered over the time period selected
- Pipeline ROI - displays a multiplier which tells you how much attribution (attributed pipeline) dollars you get back for every dollar you spent. The math is total attributed pipeline divided by the total cost. For example: If you spent $1,000 on campaigns two quarters ago and created 500 campaign touches that were assigned $5,000 in attribution within your look-ahead window, you would have a Pipeline ROI of 5x for that time period.
- Bookings ROI - displays a multiplier which tells you how many dollars in attributed bookings (attributed dollars from opps that are closed won) you get back for every dollar you spent. The math is total attributed bookings divided by the total cost. For example: If you spent $1,000 on campaigns two quarters ago and created 500 campaign touches that were assigned $5,000 in attribution within your look-ahead window, and of that $5,000, $3,000 were attributed to opps that are closed won you would have a Pipeline ROI of 3x for that time period. NOTE: it does not matter WHEN an opp becomes closed won only that it becomes closed won AND the touch date falls within the look ahead period, which is based on opp create
Time Cohort Table Widget
This table allows you to see ROI performance over time at an aggregated level.
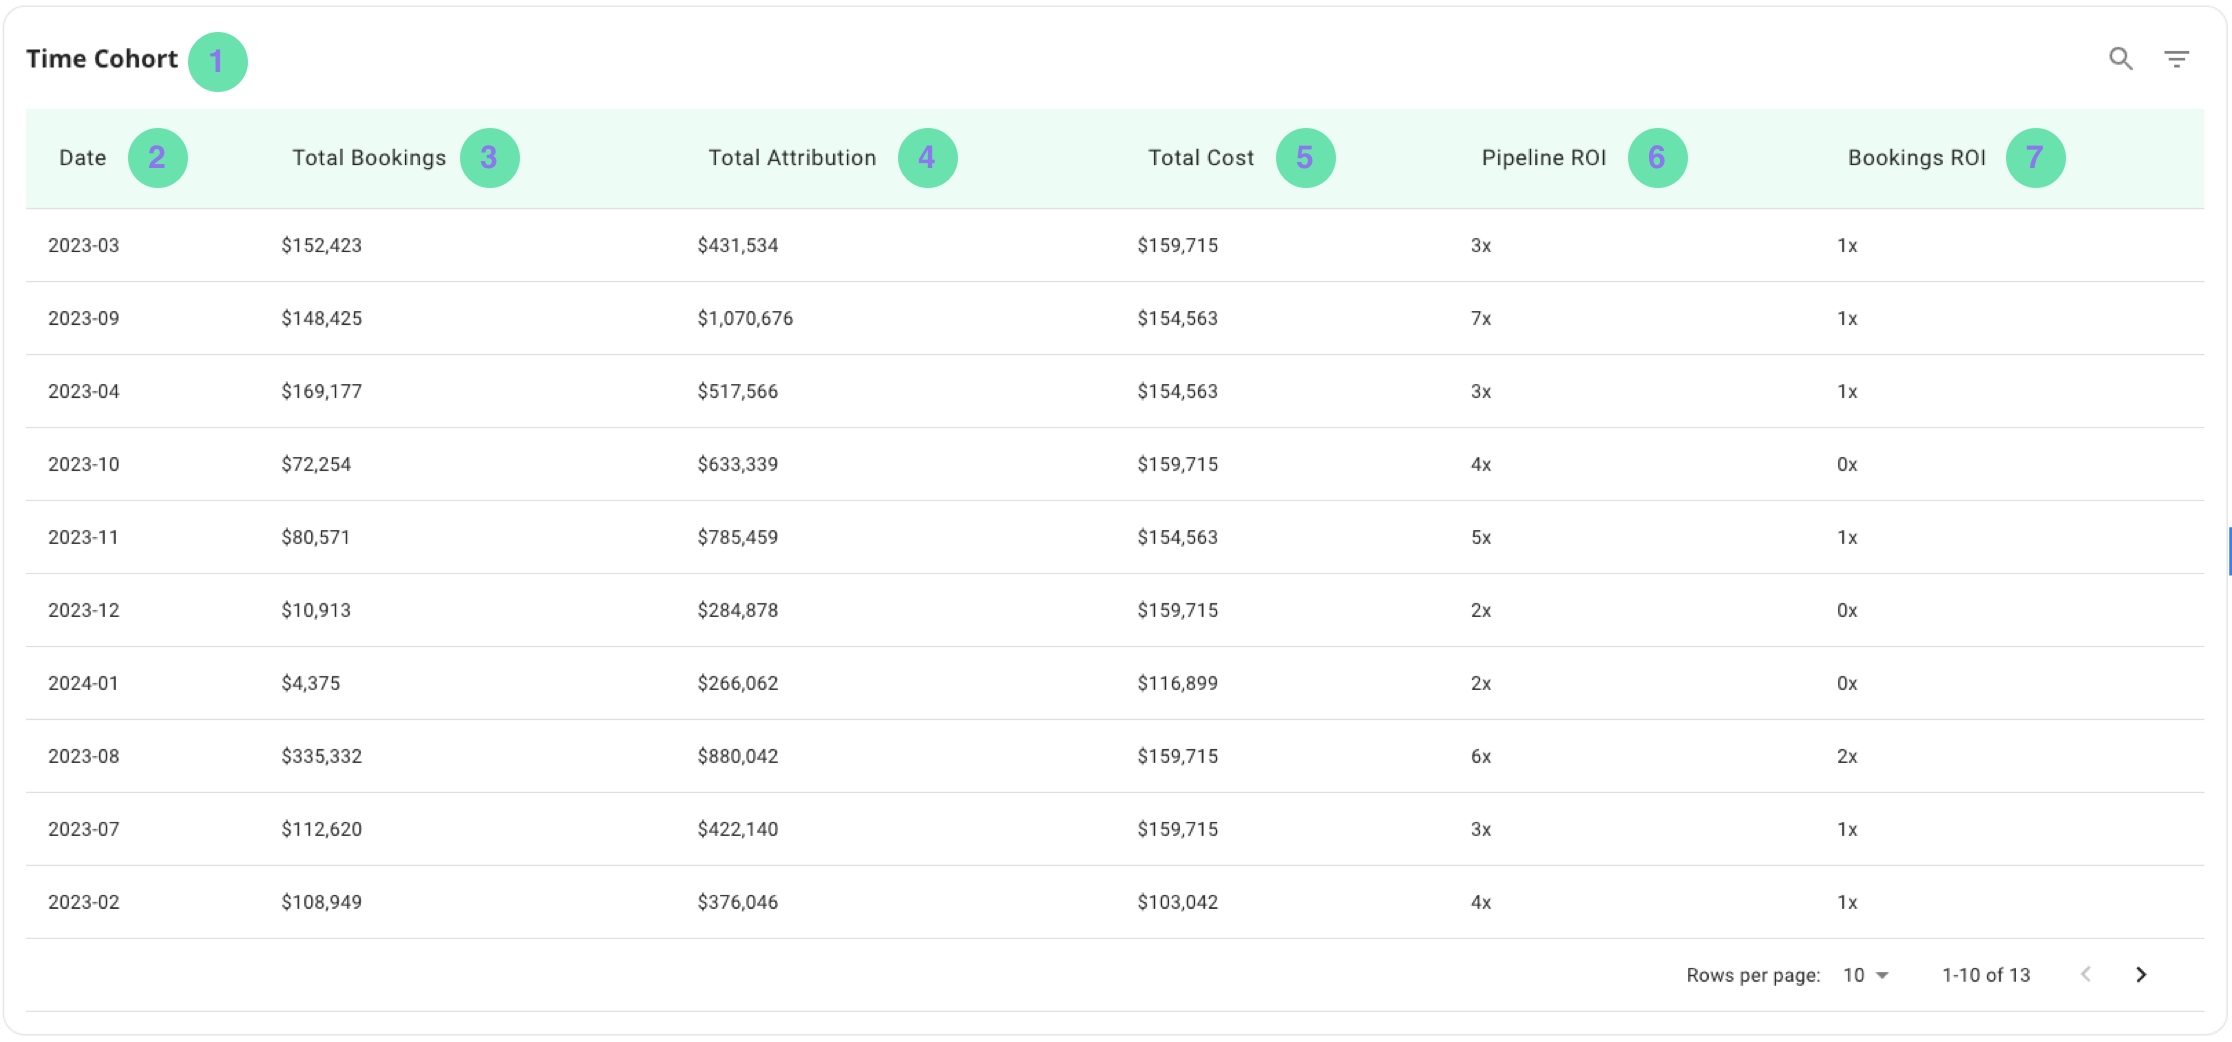
- Time Cohort - this shows aggregated ROI information over time
- Date - will display the time period formatted like YYYY-MM
- Total Bookings - will display the total dollar amount of Closed Won Opportunities for the given month
- Total Attribution - will display the total dollar amount of Attribution generated for the given month
- Total Cost - will display the sum of spend entered by channel for the given month
- Pipeline ROI - displays the multiplier of Pipeline dollars generated for each channel based on dollars spent for a given month.
- Bookings ROI - displays the multiplier of Closed Won Opportunities dollars generated for each channel based on dollars spent for a given month.