System Overview
Getting Started
New to CaliberMind - Start Here!
How do I use CaliberMind's search functionality?
Company or Account Detail - Search Results
Campaign Detail - Search Results
Person Detail - Search Results
Opportunity Detail - Search Results
How Does CaliberMind Define a "Channel"?
What Is a CaliberMind Event or Event Table?
How to use Dashboards
CaliberMind Home Page - Updated
Quick Link Bookmarks
Connectors / Integrations
CaliberMind Connectors - Start Here!
Adding Your First Connector
CaliberMind Connectors
How to Connect: Act-On
How To Connect: AdRoll / RollWorks
How to Connect: G2, Bombora, or 6sense
How to Connect: Google Ads [via FiveTran]
How To Connect: Google Analytics
How to Connect: Google Sheets
How To Connect: HubSpot
How to Connect: Klaviyo [via FiveTran]
How To Connect: LinkedIn Ads
How To Connect: Marketo
How To Connect: Microsoft Dynamics
How To Connect: Outreach
How to Connect: Pardot [via FiveTran]
How to Connect: Salesforce [via FiveTran]
How to Connect: Segment [via FiveTran]
How to Connect: Twitter [via FiveTran]
How to Connect: ZoomInfo / DiscoverOrg
How To Connect: Google Campaign Manager 360
Kickfire
Setting Up the LinkedIn Push Connector
Setting Up the Salesforce Push Connector
How to Connect: Slack
Power BI/ Tableau/ Looker Connectors Article
Connecting Your Data Warehouse to CaliberMind - Start Here!
Connecting Tableau to CaliberMind
CaliberMind Data Export to Google Cloud Storage
Ingesting CaliberMind Data Into Snowflake
Pushing CaliberMind Person Engagement Data to Salesforce
Integrations Appendix by Connector
SFTP Connector - Updated 2021
Replicating CaliberMind Attribution Data to Salesforce
How to Connect Facebook Ads
How To Connect: Google Search Ads 360
KickFire De-Anonymization in CaliberMind
Field History SFDC Limits (Salesforce)
SFTP Synced Files - Making a Data Change
Connections - Email Notifications
CaliberMind Data Access FAQs
Microsoft Bing Connector [via FiveTran]
Connector Health and Web Tracker Health reports
Connectors Status Page
In-App Notifications
CaliberMind IP Addresses for Whitelisting
Developer Guide
Developer Guide - Start Here!
CaliberMind Entity Relations and System Tables
What is Google BigQuery
CaliberMind Common Data Sources
CaliberMind Identity Levels
System Configuration
Configuring Funnels
How to Set Up and Configure Funnels
Funnel Stages Configuration and Stage Definitions
Funnels FAQs Technical Documentation
Funnel Company Inclusion Configuration
Event Explore for Funnels
Funnel History Event Configuration
Funnel Static Event Configuration
Funnel Person Inclusion Configuration
Funnel Person Status Exits
Object Manager: Campaign Member
How to See Your Object Manager History and Revert Back to Previous Versions
Setting Your Saved Filters for In-App Reporting
Setting Up UTM Mapping in CaliberMind
UTM Parameters Formatting and Best Practices
Standard Channel Logic
Channel Ranking Logic
Custom SQL Data Transformations
Add BigQuery Users within CaliberMind
Remove a BigQuery User within CaliberMind
Adding Custom Columns in Salesforce
How to Email CaliberMind Reports
Setting Up Account Trend Emails
How does CaliberMind normalize the raw data for use?
List Builder
List Builder - Start Here!
What are Lists?
Creating a List Using the List Builder - Step-by-Step Instructions
Use Case Videos - Creating a List Using the List Builder
Importing a List
Downloading a List - Step-by-Step Instructions
Account List Upload - File Requirements
People List Upload - File Requirements
Campaign List Upload - File Requirements
Creating an Account List From a Campaign
Creating Company Lists in List Builder
Creating Company Lists using SQL
How to create a list of all Opportunities that have a very low Engagement
Where is my Segments Menu?
Keyboard Shortcuts using SQL
Web Tracker Installation & Settings
Web Tracker and Installation Settings - Start Here!
Installing AnalyticsJS (CaliberMind snippet)
Two ways to identify prospects that submit a form containing email address using AnalyticsJS
Install AnalyticsJS on a HubSpot website
Using AnalyticsJS Identify on embedded Hubspot forms
Using AnalyticsJS Identify on embedded Marketo forms
Types of Analytics.js Calls
Analytics.JS Overview
Using Analytics.js to Track Web and Product Events
How Cookie Settings Affect the Analytics.JS Tracking Script
Google Tag Manager (GTM) Ad Blockers
Using AnalyticsJS with Drift
Using AnalyticsJS with Qualified
How to check your AnalyticsJS implementation
Identify users using Intercom Messenger
Flows
CaliberMind's Most Popular Flows | Automations
How to use QuickFlows
Flows Status Page
Merge records in Salesforce CRM
Add a Quick-Flow to Salesforce Campaign
Using ClearBit Flows
Setting Up Workflow - Lead Deduplication
ZoomInfo - Add-to/Enrich your database
Setting Up Workflow - Website Repair
Setting Up Workflow - Account Deduplication
Creating Sales Campaigns from Salesloft and Outreach Activities
Setting Up Workflow - Contact Deduplication
Campaigns
Campaigns - Start Here!
Custom Programs for Campaigns
Campaign-Program Membership
Custom Campaigns
Program Logic for Campaigns
Setting Up Answers
Setting Up Answers - Start Here!
Using CaliberMind Answers to Understand Campaign Performance
Using CaliberMind Answers to Understand Account Engagement
Using CaliberMind Answers to Understand Funnel Performance
Using CaliberMind Answers to Understand Funnel Impact
Using CaliberMind Answers to Understand Funnel Flow
Ask Cal Custom AI Answer
Ask Cal Custom Answers: Use Cases
User Administration & SSO
Administration and SSO - Start Here!
Single Sign On (SSO) Setup
Manage Users - Viewing, Inviting, Updating Users and Roles
User Authentication and Provisioning
CaliberMind Data Warehouse Access in Google BigQuery
CaliberMind Insights Dashboards
Working in Insights
CaliberMind Insights - Browser Requirements
CaliberMind Insights - Sharing Dashboards & User Permissions
CaliberMind Insights - Navigating to Insights/Dashboard
CaliberMind Insights - Using Dashboards
CaliberMind Insights - Dashboard Refresh Schedule
CaliberMind Insights - Application Concepts and Terminology
CaliberMind Insights - Filters & Aggregation Type
Building Dashboards - Insights
Attribution Dashboards - Insights
Insights - Attribution - Start Here!
Insights - Attribution Terminology and Key Concepts
Insights - Attribution Overview Dashboard 2.0
Engagement Dashboards - Insights
Insights - Engagement - Start Here!
Insights - Engagement - Dashboard Terminology & Key Concepts
Insights - Engagement Overview
Insights - Engagement - System Account Detail
Insights - Engagement - Person Detail
Build Insights Dashboards - Start Here!
Creating a Custom Pipeline Dashboard (VIDEO)
CaliberMind Insights - Creating Custom Dashboards
Build Your Own Insights Pipeline Dashboard
Building Formulas with Functions
Insights - ROAS Dashboard Use Cases
Creating and Editing a Widget Formula
Using Conditional Statements
How is CaliberMind ROAS Reporting Different than Insights ROI?
Insights - ROI - Start Here!
How to Create a Filter Bookmark
Create Date Range Filters - Step-by-Step
Creating Formulas Based on Criteria and Conditions (Filters)
Insights Data Connector Health Dashboard
Dashboard Function Reference
Introduction to Formulas - Start Here!
Insights Web Tracker Health Dashboard
Using Quick Functions
Insights - ROAS Terminology & Key Concepts
Insights Engagement Dashboard - Aggregation Dates
Filters
Object Mapping for Filters - Start Here!
Custom Configuration for Object Mapping
Object Mapping Filters
How to Map Your Salesforce Opportunity Revenue Field
Object Mapping: Create a Filter
Object Mapping: Create a Mapping
Object Mapping: Create a Replacement
Object Mapping: Create a Campaign Substitution
Filters Update for Creating Filter Sets
Filter Drawer Definitions
CaliberMind Sandbox
GDPR Compliance with CaliberMind
Data Dictionary
Attribution
Analytics
Attribution
Attribution Overview: Summary Tab
Attribution Overview: Comparisons Tab
Attribution Overview: Explore Tab
Attribution Overview: Opps Tab
Attribution Overview: People Tab
Attribution Overview: Events Tab
Campaign Types: Best Practices for Easy-to-Read Attribution
Virtual Campaigns in CaliberMind
Attribution - CaliberMind versus Embedded Attribution in Salesforce?
Removal effect with a Markov chain model
Attribution Reports Summary
Demand Generation
Data Integrity
Customer Success
Understanding Reports
CaliberMind Analytics Concepts
Overview of Analytics and Attribution
Filters and Hyperlinks
Using the Engagement Trending Report
Analytics Reporting: Salesforce Custom Column Filter Support
Using Tags to Organize Your Lists
Attribution Overview - Campaign Performance Table
Using Campaign Lists in Dashboards
Using Company Lists in Dashboards
CaliberMind Metrics Definition
Product Attribution Dashboard
Self-Hosting CaliberMind AnalyticsJS
ROI
Revolutionizing Marketing ROI: CaliberMind's Innovative New Approach
Return On Ad Spend Dashboards
Revenue Contribution Reports Summary
Channel ROI Overview
Creating and maintaining a custom advertising budget for ROAS
Best Practices for Tracking Return-on-Ad-Spend (ROAS)
Why Is CaliberMind ROAS or ROI Different Than My Ad Platform?
Campaign ROI Overview
Budget for ROI Channel Reporting
Attribution Models
Choosing the Right Attribution Model
Attribution Models: First-Touch
Attribution Models: W-Shaped
Attribution Models: Middle
Chain-Based Attribution Model
The A-Shaped Model
Configurable Widgets
Ad Performance Report - Summary Tab
Ad Performance Report - Attribution Tab
Funnels
Funnels 101
Funnels - Start Here!
Marketing & Sales Funnel Foundations
What is a Marketing Funnel?
Sales Funnel Journey: Questions and Answers
Common Funnel Issues
Sales Funnel Glossary
Funnel Stage Definitions
Funnel Terms and Concepts
Sales Funnel Metrics
What is the difference between an Active Journey and a Journey?
In-App Funnels
Funnel Overview: Summary Tab
Funnel Overview: Progression Tab
Funnel Overview: Cohort Tab
Funnel Overview: Stage Analyzer Tab
Funnel Overview: Comparison Tab
Funnel Overview: Journeys Tab
Insights Funnels
Funnels Use Cases
What channels move journeys through a given stage?
How can I see the number of journeys in or passing through a funnel stage during a period of time?
What touches are influencing each step in the funnel?
How do I see the first event (or "tipping point") in each stage of my funnel?
Where are my customers stuck in journeys?
How do I know the last event that happened before a journey stage change?
How do I identify stage conversion rates?
Funnel Configuration - Insights
Funnel Trigger Events Dashboard
Insights Funnels Reports Explained
Funnel Trend Dashboard
What is a Starter Funnel?
Funnel Cohort Analysis Dashboard
Funnel Cohort Analysis Use Cases
Funnel Data Explore Dashboard
Introducing CaliberMind's Funnels
Funnels - Lead, Contact, Account, Opportunity Statuses and Stages
Pressure Event Dashboard 101
Demand Generation Funnel Dashboard
Engagement and ABM
Engagement Scoring
Model Configuration
Customize Engagement Scoring Models - Start Here!
Engagement Scoring Models Overview
How to Change Event Touch Scores
How to Add or Change Engagement Score Multipliers
Add or Change Engagement Score Filters
Create Multiple Engagement Score Models
Which touches and events are we scoring?
Sales Opportunity Data Model
Engagement Scoring Time Decay - How It Works & How to Change It
Custom Attribution Configuration - Custom Weighting
Using Engagement Score to Trigger an Update in Salesforce
Default ABM Scoring Logic
Recommended Weights for Engagement Scores
Engagement Reporting
Engagement: Summary Tab
Engagement Overview: Companies Tab
Engagement Overview: People Tab
Engagement Overview: Campaigns Tab
Engagement Overview: Explore Tab
Company Engagement AI Summary
Account-Based Marketing Reports
Linking to CaliberMind Reports in Salesforce
ABM Best Practices
Account-to-Lead (A2L) Matching
Lead-to-Account Matching (L2A)
Pushing CaliberMind ABM Scoring Fields to Salesforce.com
Slack AI Company Engagement Summary
3rd Party Intent Signals with Bombora
Tutorials and Use Cases
Digital Marketing Terminology
Customizing Report Visibility (Show/Hide)
How to Manage Your Offsite Events Using CaliberMind
How can I manage my BDR/SDR team activities with CaliberMind?
Combining Engagement Score with Attribution
Enabling the Sales Teams to see the Entire Buyers Journey
How Can I Identify High Risk Opportunities?
How does Sales leverage CaliberMind? Some key use cases.
Running a Sales/Pipeline Review with CaliberMind
How Is CaliberMind Different From My CRM Attribution?
CRM Campaign Member Status and Campaign Response Best Practices
How Do I Optimize Advertising Spend?
Campaign Best Practices Across Systems
How do I use CaliberMind to shorten our sales cycle?
Answering Business Questions Using CaliberMind Reports
Which of my leads are the most engaged?
How Do I Know If a Campaign Is Good or Bad?
How to Flatten Your Campaign Structure in Salesforce
Table of Contents
- All Categories
- Funnels
- Insights Funnels
- Funnels Use Cases
- How can I see the number of journeys in or passing through a funnel stage during a period of time?
How can I see the number of journeys in or passing through a funnel stage during a period of time?
How can I see the number of journeys in or passing through a funnel stage during a period of time?
Introduction
One of the early indicators most marketing teams are given as a goal or key performance indicator (KPI) is the number of people or accounts that enter the marketing qualified lead or automatically qualified lead stage in a given period.
In product-led organizations, marketing may also be responsible for driving free trials and then product qualified leads.
Once sales is involved, there will be several stages that are created when an opportunity stage field is updated or a major event happens with the sales team and the prospect.
Anticipating and meeting the volume needed at each stage to have a healthy book of business is what drives business leaders to create KPIs and push teams to work together to hit the overall bookings goal.
All stages of your funnel are customized to fit your organization's needs, and CaliberMind has given you a few ways to quickly view these KPIs and then drill in for deeper analysis.
The example to illustrate the solution -
You're responsible for generating qualified leads. You're trying to demonstrate that your marketing department did its job in creating viable leads for the sales team. This is based on the rules you've created to define a Marketing Qualified Account (MQA). You want to be able to quickly view the number of journeys that met this particular stage in over a customized date range.
USE CASE ANSWER #1 - FUNNELS HOMEPAGE
Don't get lost in the noise - pull up the Funnel Homepage
De-cluttering the way you see data is critical. A single source of truth can be provided to your marketing and sales teams by using CaliberMind's Funnel Homepage.
By having a single source of truth for all of your data, teams can make more informed decisions that are better aligned with the overall company strategy. Additionally, the data can be visualized across multiple dimensions, giving leaders a comprehensive view of the current state of their business and what areas need more focus. This allows them to make more informed decisions that are tailored to their business needs and are more likely to result in success.
Click on the link for more on CaliberMind's Marketing Funnel Homepage.
Funnel Homepage Overview
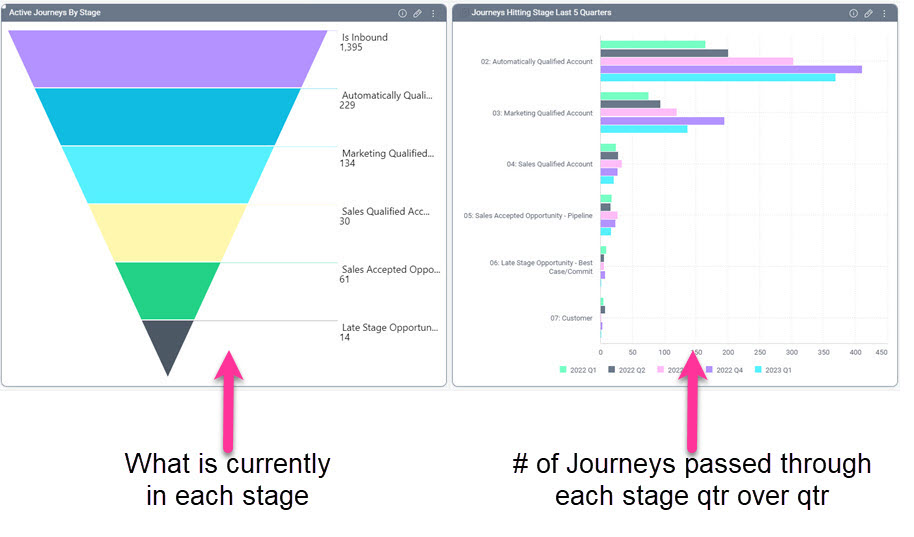
The left-hand side of the Funnel Homepage shows what's currently active or open in each stage, regardless of when it first hit the stage. On the right, a chart shows a snapshot of how many accounts or people passed through each stage by calendar quarter. If your company uses a calendar year, the chart on the right is a quick way to view your stage volume KPIs.
It also helps people understand if they are improving over prior quarters and if the current quarter is on pace to meet or exceed the prior quarter.
USE CASE ANSWER #2 - FUNNEL DATA EXPLORE DASHBOARD
Now that we have covered the foundations of CaliberMind's Funnel Homepage, let's look at the types of customer journey analysis that can be conducted within CaliberMind's Data Explore Dashboard.
Trace and Explore the Journey through the Funnel Stage by Stage
The funnel data explore dashboard can help teams quickly spot trends, understand customer behavior, and create more effective campaigns to drive revenue. With deeper insights into prospect data, teams can better understand what works and what doesn't, and make data-driven decisions that result in increased sales and higher ROI.
We'll use the CaliberMind Data Explore Dashboard to view the total number of accounts or people (depending on your funnel build) that passed through each stage of the funnel in a given time frame, and drill down for a more granular look at the data below the surface.
Funnel Data Explore Dashboard Overview
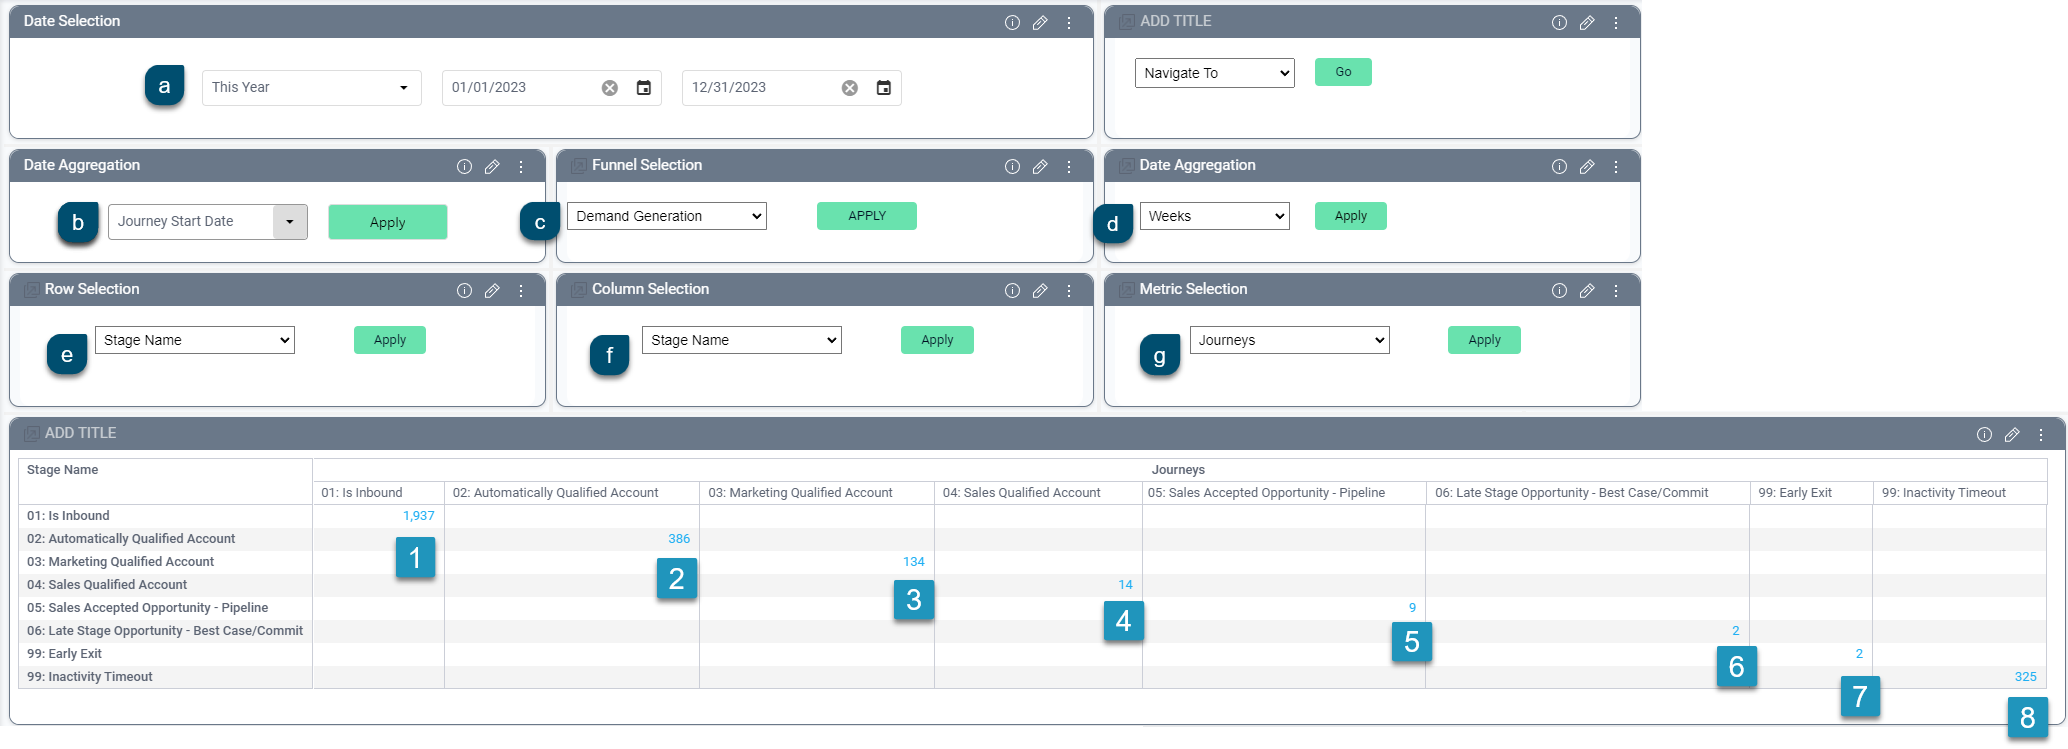
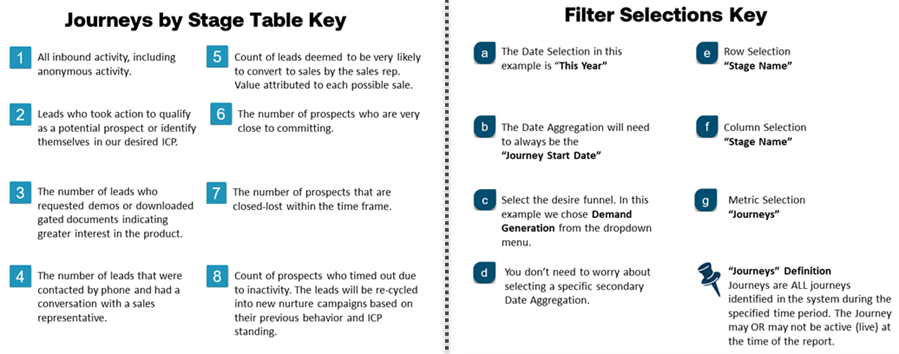
The guide above shows how to configure a simple Data Explore view that shows the number of accounts (in this example Funnel) that passed through each stage in the select time range.
USE CASE ANSWER #3 - COHORT ANALYSIS DASHBOARD
In a cohort, people are grouped based on a shared characteristic. Typically, the cohort is grouped by when a particular stage in the funnel was reached by a group of accounts or people (depending on your funnel configuration). A cohort analysis compares different groups at the same point in time based on their behavior over time. By comparing the data of different cohorts, you can draw insights about how different groups interact with your product or service. This can help you identify trends and target the right audience for your product or service.
Understanding the path to purchase
By seeing volume over time and how efficiently each stage is converting, we can identify areas for improvement. For example, if we see our conversion rate from qualified lead to opportunity has been decreasing, we would ask our operations team to investigate whether an integration broke or configuration change made it harder for sales to follow up on the leads. We would also see if the leads we are generating are in the right ICP, and whether our marketing mix changed. Finally, we would investigate the sales team's time to follow up and get feedback to see if they feel lead quality went down and create an internal-facing campaign to get them re-engaged in lead follow-up.
Cohort Dashboard Overview
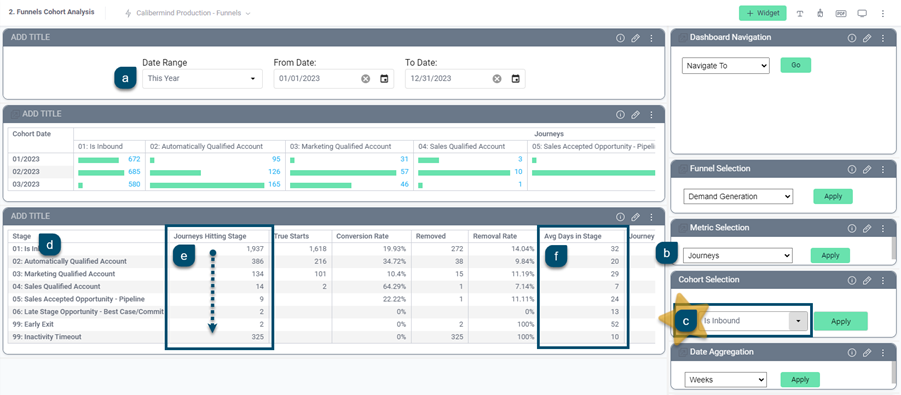
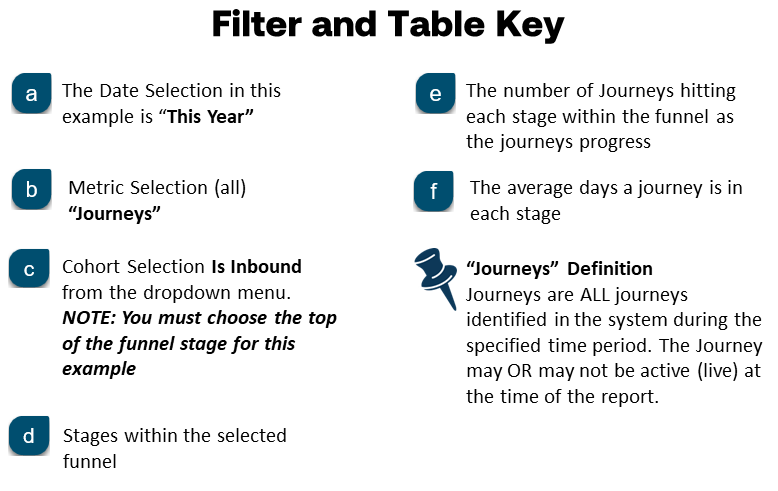
The key above is how we would use the Cohort Analysis dashboard to analyze data cohorted by our first stage, or 01. Inbound. This helps us see how the volume is changing by the date the inbound leads came in (top table) and analyze how the total population has advanced through the funnel.