System Overview
Getting Started
New to CaliberMind - Start Here!
How do I use CaliberMind's search functionality?
Company or Account Detail - Search Results
Campaign Detail - Search Results
Person Detail - Search Results
Opportunity Detail - Search Results
How Does CaliberMind Define a "Channel"?
What Is a CaliberMind Event or Event Table?
How to use Dashboards
CaliberMind Home Page - Updated
Quick Link Bookmarks
Connectors / Integrations
CaliberMind Connectors - Start Here!
Adding Your First Connector
CaliberMind Connectors
How to Connect: Act-On
How To Connect: AdRoll / RollWorks
How to Connect: G2, Bombora, or 6sense
How to Connect: Google Ads [via FiveTran]
How To Connect: Google Analytics
How to Connect: Google Sheets
How To Connect: HubSpot
How to Connect: Klaviyo [via FiveTran]
How To Connect: LinkedIn Ads
How To Connect: Marketo
How To Connect: Microsoft Dynamics
How To Connect: Outreach
How to Connect: Pardot [via FiveTran]
How to Connect: Salesforce [via FiveTran]
How to Connect: Segment [via FiveTran]
How to Connect: Twitter [via FiveTran]
How to Connect: ZoomInfo / DiscoverOrg
How To Connect: Google Campaign Manager 360
Kickfire
Setting Up the LinkedIn Push Connector
Setting Up the Salesforce Push Connector
How to Connect: Slack
Power BI/ Tableau/ Looker Connectors Article
Connecting Your Data Warehouse to CaliberMind - Start Here!
Connecting Tableau to CaliberMind
CaliberMind Data Export to Google Cloud Storage
Ingesting CaliberMind Data Into Snowflake
Pushing CaliberMind Person Engagement Data to Salesforce
Integrations Appendix by Connector
SFTP Connector - Updated 2021
Replicating CaliberMind Attribution Data to Salesforce
How to Connect Facebook Ads
How To Connect: Google Search Ads 360
KickFire De-Anonymization in CaliberMind
Field History SFDC Limits (Salesforce)
SFTP Synced Files - Making a Data Change
Connections - Email Notifications
CaliberMind Data Access FAQs
Microsoft Bing Connector [via FiveTran]
Connector Health and Web Tracker Health reports
Connectors Status Page
In-App Notifications
CaliberMind IP Addresses for Whitelisting
Developer Guide
Developer Guide - Start Here!
CaliberMind Entity Relations and System Tables
What is Google BigQuery
CaliberMind Common Data Sources
CaliberMind Identity Levels
System Configuration
Configuring Funnels
How to Set Up and Configure Funnels
Funnel Stages Configuration and Stage Definitions
Funnels FAQs Technical Documentation
Funnel Company Inclusion Configuration
Event Explore for Funnels
Funnel History Event Configuration
Funnel Static Event Configuration
Funnel Person Inclusion Configuration
Funnel Person Status Exits
Object Manager: Campaign Member
How to See Your Object Manager History and Revert Back to Previous Versions
Setting Your Saved Filters for In-App Reporting
Setting Up UTM Mapping in CaliberMind
UTM Parameters Formatting and Best Practices
Standard Channel Logic
Channel Ranking Logic
Custom SQL Data Transformations
Add BigQuery Users within CaliberMind
Remove a BigQuery User within CaliberMind
Adding Custom Columns in Salesforce
How to Email CaliberMind Reports
Setting Up Account Trend Emails
How does CaliberMind normalize the raw data for use?
List Builder
List Builder - Start Here!
What are Lists?
Creating a List Using the List Builder - Step-by-Step Instructions
Use Case Videos - Creating a List Using the List Builder
Importing a List
Downloading a List - Step-by-Step Instructions
Account List Upload - File Requirements
People List Upload - File Requirements
Campaign List Upload - File Requirements
Creating an Account List From a Campaign
Creating Company Lists in List Builder
Creating Company Lists using SQL
How to create a list of all Opportunities that have a very low Engagement
Where is my Segments Menu?
Keyboard Shortcuts using SQL
Web Tracker Installation & Settings
Web Tracker and Installation Settings - Start Here!
Installing AnalyticsJS (CaliberMind snippet)
Two ways to identify prospects that submit a form containing email address using AnalyticsJS
Install AnalyticsJS on a HubSpot website
Using AnalyticsJS Identify on embedded Hubspot forms
Using AnalyticsJS Identify on embedded Marketo forms
Types of Analytics.js Calls
Analytics.JS Overview
Using Analytics.js to Track Web and Product Events
How Cookie Settings Affect the Analytics.JS Tracking Script
Google Tag Manager (GTM) Ad Blockers
Using AnalyticsJS with Drift
Using AnalyticsJS with Qualified
How to check your AnalyticsJS implementation
Identify users using Intercom Messenger
Flows
CaliberMind's Most Popular Flows | Automations
How to use QuickFlows
Flows Status Page
Merge records in Salesforce CRM
Add a Quick-Flow to Salesforce Campaign
Using ClearBit Flows
Setting Up Workflow - Lead Deduplication
ZoomInfo - Add-to/Enrich your database
Setting Up Workflow - Website Repair
Setting Up Workflow - Account Deduplication
Creating Sales Campaigns from Salesloft and Outreach Activities
Setting Up Workflow - Contact Deduplication
Campaigns
Campaigns - Start Here!
Custom Programs for Campaigns
Campaign-Program Membership
Custom Campaigns
Program Logic for Campaigns
Setting Up Answers
Setting Up Answers - Start Here!
Using CaliberMind Answers to Understand Campaign Performance
Using CaliberMind Answers to Understand Account Engagement
Using CaliberMind Answers to Understand Funnel Performance
Using CaliberMind Answers to Understand Funnel Impact
Using CaliberMind Answers to Understand Funnel Flow
Ask Cal Custom AI Answer
Ask Cal Custom Answers: Use Cases
User Administration & SSO
Administration and SSO - Start Here!
Single Sign On (SSO) Setup
Manage Users - Viewing, Inviting, Updating Users and Roles
User Authentication and Provisioning
CaliberMind Data Warehouse Access in Google BigQuery
CaliberMind Insights Dashboards
Working in Insights
CaliberMind Insights - Browser Requirements
CaliberMind Insights - Sharing Dashboards & User Permissions
CaliberMind Insights - Navigating to Insights/Dashboard
CaliberMind Insights - Using Dashboards
CaliberMind Insights - Dashboard Refresh Schedule
CaliberMind Insights - Application Concepts and Terminology
CaliberMind Insights - Filters & Aggregation Type
Building Dashboards - Insights
Attribution Dashboards - Insights
Insights - Attribution - Start Here!
Insights - Attribution Terminology and Key Concepts
Insights - Attribution Overview Dashboard 2.0
Engagement Dashboards - Insights
Insights - Engagement - Start Here!
Insights - Engagement - Dashboard Terminology & Key Concepts
Insights - Engagement Overview
Insights - Engagement - System Account Detail
Insights - Engagement - Person Detail
Build Insights Dashboards - Start Here!
Creating a Custom Pipeline Dashboard (VIDEO)
CaliberMind Insights - Creating Custom Dashboards
Build Your Own Insights Pipeline Dashboard
Building Formulas with Functions
Insights - ROAS Dashboard Use Cases
Creating and Editing a Widget Formula
Using Conditional Statements
How is CaliberMind ROAS Reporting Different than Insights ROI?
Insights - ROI - Start Here!
How to Create a Filter Bookmark
Create Date Range Filters - Step-by-Step
Creating Formulas Based on Criteria and Conditions (Filters)
Insights Data Connector Health Dashboard
Dashboard Function Reference
Introduction to Formulas - Start Here!
Insights Web Tracker Health Dashboard
Using Quick Functions
Insights - ROAS Terminology & Key Concepts
Insights Engagement Dashboard - Aggregation Dates
Filters
Object Mapping for Filters - Start Here!
Custom Configuration for Object Mapping
Object Mapping Filters
How to Map Your Salesforce Opportunity Revenue Field
Object Mapping: Create a Filter
Object Mapping: Create a Mapping
Object Mapping: Create a Replacement
Object Mapping: Create a Campaign Substitution
Filters Update for Creating Filter Sets
Filter Drawer Definitions
CaliberMind Sandbox
GDPR Compliance with CaliberMind
Data Dictionary
Attribution
Analytics
Attribution
Attribution Overview: Summary Tab
Attribution Overview: Comparisons Tab
Attribution Overview: Explore Tab
Attribution Overview: Opps Tab
Attribution Overview: People Tab
Attribution Overview: Events Tab
Campaign Types: Best Practices for Easy-to-Read Attribution
Virtual Campaigns in CaliberMind
Attribution - CaliberMind versus Embedded Attribution in Salesforce?
Removal effect with a Markov chain model
Attribution Reports Summary
Demand Generation
Data Integrity
Customer Success
Understanding Reports
CaliberMind Analytics Concepts
Overview of Analytics and Attribution
Filters and Hyperlinks
Using the Engagement Trending Report
Analytics Reporting: Salesforce Custom Column Filter Support
Using Tags to Organize Your Lists
Attribution Overview - Campaign Performance Table
Using Campaign Lists in Dashboards
Using Company Lists in Dashboards
CaliberMind Metrics Definition
Product Attribution Dashboard
Self-Hosting CaliberMind AnalyticsJS
ROI
Revolutionizing Marketing ROI: CaliberMind's Innovative New Approach
Return On Ad Spend Dashboards
Revenue Contribution Reports Summary
Channel ROI Overview
Creating and maintaining a custom advertising budget for ROAS
Best Practices for Tracking Return-on-Ad-Spend (ROAS)
Why Is CaliberMind ROAS or ROI Different Than My Ad Platform?
Campaign ROI Overview
Budget for ROI Channel Reporting
Attribution Models
Choosing the Right Attribution Model
Attribution Models: First-Touch
Attribution Models: W-Shaped
Attribution Models: Middle
Chain-Based Attribution Model
The A-Shaped Model
Configurable Widgets
Ad Performance Report - Summary Tab
Ad Performance Report - Attribution Tab
Funnels
Funnels 101
Funnels - Start Here!
Marketing & Sales Funnel Foundations
What is a Marketing Funnel?
Sales Funnel Journey: Questions and Answers
Common Funnel Issues
Sales Funnel Glossary
Funnel Stage Definitions
Funnel Terms and Concepts
Sales Funnel Metrics
What is the difference between an Active Journey and a Journey?
In-App Funnels
Funnel Overview: Summary Tab
Funnel Overview: Progression Tab
Funnel Overview: Cohort Tab
Funnel Overview: Stage Analyzer Tab
Funnel Overview: Comparison Tab
Funnel Overview: Journeys Tab
Insights Funnels
Funnels Use Cases
What channels move journeys through a given stage?
How can I see the number of journeys in or passing through a funnel stage during a period of time?
What touches are influencing each step in the funnel?
How do I see the first event (or "tipping point") in each stage of my funnel?
Where are my customers stuck in journeys?
How do I know the last event that happened before a journey stage change?
How do I identify stage conversion rates?
Funnel Configuration - Insights
Funnel Trigger Events Dashboard
Insights Funnels Reports Explained
Funnel Trend Dashboard
What is a Starter Funnel?
Funnel Cohort Analysis Dashboard
Funnel Cohort Analysis Use Cases
Funnel Data Explore Dashboard
Introducing CaliberMind's Funnels
Funnels - Lead, Contact, Account, Opportunity Statuses and Stages
Pressure Event Dashboard 101
Demand Generation Funnel Dashboard
Engagement and ABM
Engagement Scoring
Model Configuration
Customize Engagement Scoring Models - Start Here!
Engagement Scoring Models Overview
How to Change Event Touch Scores
How to Add or Change Engagement Score Multipliers
Add or Change Engagement Score Filters
Create Multiple Engagement Score Models
Which touches and events are we scoring?
Sales Opportunity Data Model
Engagement Scoring Time Decay - How It Works & How to Change It
Custom Attribution Configuration - Custom Weighting
Using Engagement Score to Trigger an Update in Salesforce
Default ABM Scoring Logic
Recommended Weights for Engagement Scores
Engagement Reporting
Engagement: Summary Tab
Engagement Overview: Companies Tab
Engagement Overview: People Tab
Engagement Overview: Campaigns Tab
Engagement Overview: Explore Tab
Company Engagement AI Summary
Account-Based Marketing Reports
Linking to CaliberMind Reports in Salesforce
ABM Best Practices
Account-to-Lead (A2L) Matching
Lead-to-Account Matching (L2A)
Pushing CaliberMind ABM Scoring Fields to Salesforce.com
Slack AI Company Engagement Summary
3rd Party Intent Signals with Bombora
Tutorials and Use Cases
Digital Marketing Terminology
Customizing Report Visibility (Show/Hide)
How to Manage Your Offsite Events Using CaliberMind
How can I manage my BDR/SDR team activities with CaliberMind?
Combining Engagement Score with Attribution
Enabling the Sales Teams to see the Entire Buyers Journey
How Can I Identify High Risk Opportunities?
How does Sales leverage CaliberMind? Some key use cases.
Running a Sales/Pipeline Review with CaliberMind
How Is CaliberMind Different From My CRM Attribution?
CRM Campaign Member Status and Campaign Response Best Practices
How Do I Optimize Advertising Spend?
Campaign Best Practices Across Systems
How do I use CaliberMind to shorten our sales cycle?
Answering Business Questions Using CaliberMind Reports
Which of my leads are the most engaged?
How Do I Know If a Campaign Is Good or Bad?
How to Flatten Your Campaign Structure in Salesforce
Table of Contents
- All Categories
- System Overview
- CaliberMind Insights Dashboards
- Building Dashboards - Insights
- Insights Web Tracker Health Dashboard
Insights Web Tracker Health Dashboard
Insights Data Connector Health Dashboard
What is web tracker health?
With CaliberMind's Web Tracking Health Dashboard, you can see how many users interact with specific elements of your site or app. Clicking buttons, entering text, or submitting forms falls under this category. Monitoring these events over time can provide you with valuable insights into your users' behavior to help you improve your site.
When using the open-source Analytics.js spec, the Web Tracker Health dashboard allows you to track events. Your event stream is processed by CaliberMind via your integrations and is represented by the information produced. The Web Tracker Health dashboard provides visibility into the performance of your data flow, including the collection and reporting of data from events. It also allows for the monitoring of data flow for errors, latency, and other key performance indicators. This data is then used by CaliberMind to generate insights about the customer journey and other analytics. For example, the Web Tracker Health dashboard may display the number of page views received from each integration, the average latency of the data flow, and the number of events dropped due to errors.
CaliberMind's Data Web Tracker Health Dashboard - Purpose
When using the open-source Analytics.js spec, the Web Tracker Health dashboard allows you to track events. Your event stream is processed by CaliberMind via your integrations and is represented by the information produced. The Web Tracker Health dashboard provides visibility into the performance of your data flow, including the collection and reporting of data from events. It also allows for the monitoring of data flow for errors, latency, and other key performance indicators. This data is then used by CaliberMind to generate insights about the customer journey and other analytics.
CaliberMind's Data Connector Health Dashboard - Assumptions
We offer this feature to customers who use our analytic.JS pixel and track the AnalyticsJS page events.
Data Connector Health Dashboard - Description
How to access the feature
Go to your company's production site - NOT the site shown in the example
Dashboard Tiles
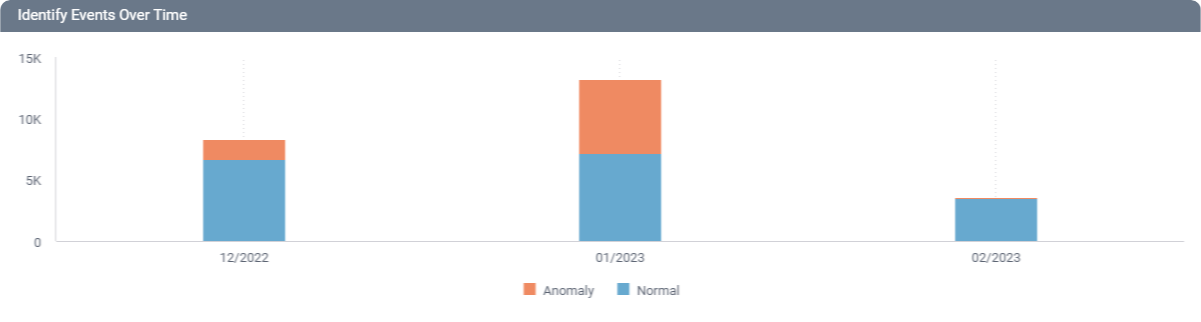
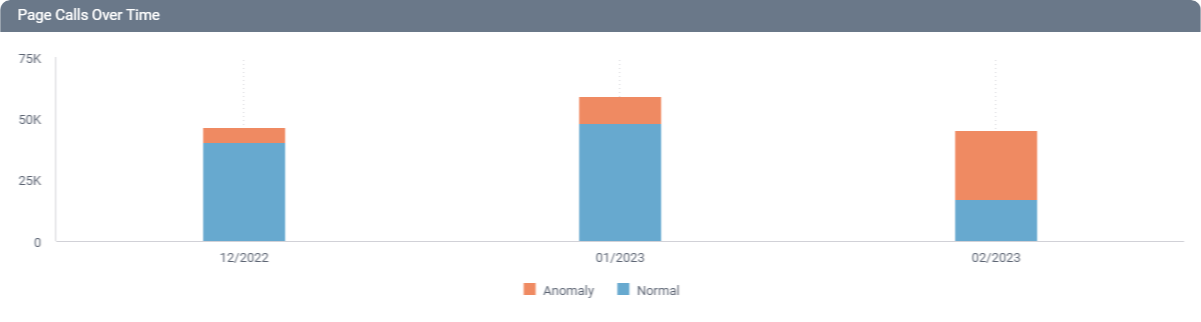
Color Code: Blue= Normal Orange= Anomaly
Days Since Last Identity

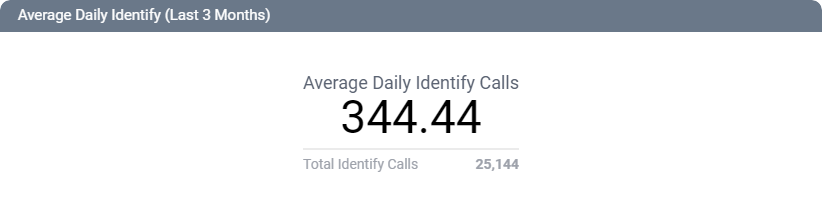
Average Daily Identify (Last 3 Months)
Days Since Last Page

Average Daily Page (Last 3 Months)

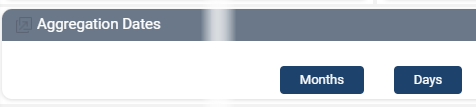
Aggregation Dates
% Breakdown - Identify Event Count (Last 3 Months)

Identify Events Over Time
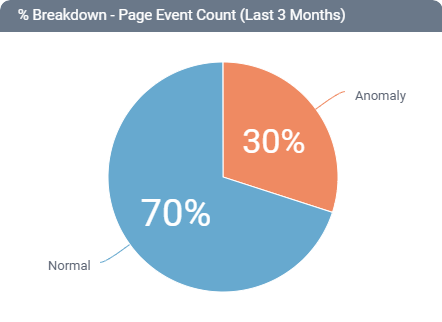
% Breakdown - Page Event Count (Last 3 Months)
Page Calls Over Time
Insights Web Tracker Health Dashboard - Use Case Scenario and Analysis
Role: Marketing Tacticians, BI, Data Analysts, Data Engineers, and Operations
Volume and Data Flow Problems
Two most common volume or data flow questions that are answered using the Web Tracker Health Dashboard are:
- Is my AnalyticsJS data flowing into CaliberMind?
- Is the daily volume of AnalyticsJS data flowing into CaliberMind within normal bounds or is something weird going on?
Analysis: The use cases listed above speak to general debugging around AnalyticsJS your IT team might go through when building out your web site vs monitoring the arrival of data into our system. Our system is primarily concerned making sure that the expected amount of AnalyticsJS data is flowing through since that can often be the most fragile part of a implementation. A prime example would be accidentally disabling the needed Javascript calls when making updates to their site. AJS data is often used for automatic lead creation and campaign attribution via UTM parameters so if this gets shut off they will see a drop in relevant leads, ROI, etc. from the rest of their stack.
Tracking Tag Issues
Two most common anomalies that may seen using the Web Tracker Health Dashboard are:
- A change pushed to the your website causing the tracking tags to fall off and stop firing
- A change pushed to a your website causing the tracking tags to fire twice causing double counting
Analysis: You should manage changes to your tags to make sure they don't negatively impact page performance. Before deployment, you should test your tags for performance and other issues. Changes to your tags can cause a number of issues, including slow loading times and conflicts with other tags on the page. Testing the tags before deployment allows you to identify and address any potential issues before they become a problem.
When testing a tag, consider the following:
- Does the tag work correctly?
- Does the tag affect the layout in any way?
- What resources does the tag load? What is the size of these resources?
- Is a long-running script triggered by the tag?
It is critical to answer these questions to understand the impact of tags on a website. This is because errors and long load times can hurt the user experience and reputation of the website. Managing tags, events, and eliminating anomalies will help your company optimize your website performance and ensure a positive user experience for your customers.