System Overview
Getting Started
New to CaliberMind - Start Here!
CaliberMind Home Page & Navigation
Signing In to CaliberMind
How do I use CaliberMind's search functionality?
Company or Account Detail - Search Results
Campaign Detail - Search Results
Person Detail - Search Results
Opportunity Detail - Search Results
How Does CaliberMind Define a "Channel"?
What Is a CaliberMind Event or Event Table?
How to use Dashboards
Connectors / Integrations
CaliberMind Connectors - Start Here!
Overview of Connectors
Adding Your First Connector
CaliberMind Connectors
How to Connect: Act-On
How To Connect: AdRoll / RollWorks
How to Connect: G2, Bombora, or 6sense
How to Connect: Google Ads [via FiveTran]
How To Connect: Google Analytics
How to Connect: Google Sheets
How To Connect: HubSpot
How to Connect: Klaviyo [via FiveTran]
How To Connect: LinkedIn Ads
How To Connect: Marketo
How To Connect: Microsoft Dynamics
How To Connect: Outreach
How to Connect: Pardot [via FiveTran]
How to Connect: Salesforce [via FiveTran]
How to Connect: Segment [via FiveTran]
How to Connect: Twitter [via FiveTran]
How to Connect: ZoomInfo / DiscoverOrg
Kickfire
Setting Up the LinkedIn Push Connector
Setting Up the Salesforce Push Connector
Power BI/ Tableau/ Looker Connectors Article
Connecting Your Data Warehouse to CaliberMind - Start Here!
Connecting Tableau to CaliberMind
CaliberMind Data Export to Google Cloud Storage
Ingesting CaliberMind Data Into Snowflake
Pushing CaliberMind Person Engagement Data to Salesforce
Integrations Appendix by Connector
SFTP Connector - Updated 2021
Replicating CaliberMind Attribution Data to Salesforce
How to Connect Facebook Ads
KickFire De-Anonymization in CaliberMind
Field History SFDC Limits (Salesforce)
SFTP Synced Files - Making a Data Change
Connections - Email Notifications
CaliberMind Data Access FAQs
Microsoft Bing Connector
Bing/Microsoft Ad's Connector
Connector Health and Web Tracker Health reports
Connectors Status Page
In-App Notifications
CaliberMind IP Addresses for Whitelisting
Developer Guide
Developer Guide - Start Here!
CaliberMind Entity Relations and System Tables
What is Google BigQuery
CaliberMind Common Data Sources
CaliberMind Identity Levels
System Configuration
Object Mapping for Filters - Start Here!
Custom Configuration for Object Mapping
Object Mapping Filters
How to Map Your Salesforce Opportunity Revenue Field
Object Mapping: Create a Filter
Object Mapping: Create a Mapping
Object Manager: Campaign Member
Object Mapping: Create a Replacement
Object Mapping: Create a Campaign Substitution
How to See Your Object Manager History and Revert Back to Previous Versions
Setting Your Saved Filters for In-App Reporting
Setting Up UTM Mapping in CaliberMind
UTM Parameters Formatting and Best Practices
Standard Channel Logic
Channel Ranking Logic
Custom SQL Data Transformations
Add BigQuery Users within CaliberMind
Remove a BigQuery User within CaliberMind
Adding Custom Columns in Salesforce
How to Email CaliberMind Reports
Setting Up Account Trend Emails
List Builder
List Builder - Start Here!
What are Lists?
Creating a List Using the List Builder - Step-by-Step Instructions
Use Case Videos - Creating a List Using the List Builder
Importing a List
Downloading a List - Step-by-Step Instructions
Account List Upload - File Requirements
People List Upload - File Requirements
Campaign List Upload - File Requirements
Creating an Account List From a Campaign
Creating Company Lists in List Builder
Creating Company Lists using SQL
How to create a list of all Opportunities that have a very low Engagement
Where is my Segments Menu?
Keyboard Shortcuts using SQL
Web Tracker Installation & Settings
Web Tracker and Installation Settings - Start Here!
Installing AnalyticsJS (CaliberMind snippet)
Two ways to identify prospects that submit a form containing email address using AnalyticsJS
Install AnalyticsJS on a HubSpot website
Using AnalyticsJS Identify on embedded Hubspot forms
Using AnalyticsJS Identify on embedded Marketo forms
Types of Analytics.js Calls
Analytics.JS Overview
Using Analytics.js to Track Web and Product Events
How Cookie Settings Affect the Analytics.JS Tracking Script
Google Tag Manager (GTM) Ad Blockers
Using AnalyticsJS with Drift
Using AnalyticsJS with Qualified
How to check your AnalyticsJS implementation
Identify users using Intercom Messenger
Flows
CaliberMind's Most Popular Flows | Automations
How to use QuickFlows
Flows Status Page
Merge records in Salesforce CRM
Add a Quick-Flow to Salesforce Campaign
Using ClearBit Flows
Setting Up Workflow - Lead Deduplication
ZoomInfo - Add-to/Enrich your database
Setting Up Workflow - Website Repair
Setting Up Workflow - Account Deduplication
Creating Sales Campaigns from Salesloft and Outreach Activities
Setting Up Workflow - Contact Deduplication
Campaigns
Campaigns - Start Here!
Custom Programs for Campaigns
Campaign-Program Membership
Custom Campaigns
Program Logic for Campaigns
Setting Up Answers
Setting Up Answers - Start Here!
Using CaliberMind Answers to Understand Campaign Performance
Using CaliberMind Answers to Understand Account Engagement
Using CaliberMind Answers to Understand Funnel Performance
Using CaliberMind Answers to Understand Funnel Impact
Using CaliberMind Answers to Understand Funnel Flow
User Administration & SSO
Administration and SSO - Start Here!
Single Sign On (SSO) Setup
Manage Users - Viewing, Inviting, Updating Users and Roles
User Authentication and Provisioning
CaliberMind Data Warehouse Access in Google BigQuery
CaliberMind Insights Dashboards
Working in Insights
CaliberMind Insights - Browser Requirements
CaliberMind Insights - Sharing Dashboards & User Permissions
CaliberMind Insights - Navigating to Insights/Dashboard
CaliberMind Insights - Using Dashboards
CaliberMind Insights - Dashboard Refresh Schedule
CaliberMind Insights - Application Concepts and Terminology
CaliberMind Insights - Filters & Aggregation Type
Building Dashboards - Insights
Attribution Dashboards - Insights
Insights - Attribution - Start Here!
Insights - Attribution Terminology and Key Concepts
Insights - Attribution Overview Dashboard 2.0
Engagement Dashboards - Insights
Insights - Engagement - Start Here!
Insights - Engagement - Dashboard Terminology & Key Concepts
Insights - Engagement Overview
Insights - Engagement - System Account Detail
Insights - Engagement - Person Detail
Build Insights Dashboards - Start Here!
Creating a Custom Pipeline Dashboard (VIDEO)
CaliberMind Insights - Creating Custom Dashboards
Build Your Own Insights Pipeline Dashboard
Building Formulas with Functions
Insights - ROAS Dashboard Use Cases
Creating and Editing a Widget Formula
Using Conditional Statements
How is CaliberMind ROAS Reporting Different than Insights ROI?
Insights - ROI - Start Here!
How to Create a Filter Bookmark
Create Date Range Filters - Step-by-Step
Creating Formulas Based on Criteria and Conditions (Filters)
Insights Data Connector Health Dashboard
Dashboard Function Reference
Introduction to Formulas - Start Here!
Insights Web Tracker Health Dashboard
Using Quick Functions
Insights - ROAS Terminology & Key Concepts
Insights Engagement Dashboard - Aggregation Dates
CaliberMind Sandbox
GDPR Compliance with CaliberMind
Data Dictionary
Attribution
Analytics
Attribution
Attribution Overview: Summary Tab
Attribution Overview: Comparisons Tab
Attribution Overview: Explore Tab
Attribution Overview: Opps Tab
Attribution Overview: People Tab
Attribution Overview: Events Tab
Campaign Types: Best Practices for Easy-to-Read Attribution
Virtual Campaigns in CaliberMind
Attribution - CaliberMind versus Embedded Attribution in Salesforce?
Removal effect with a Markov chain model
Attribution Reports Summary
Demand Generation
Data Integrity
Customer Success
Understanding Reports
CaliberMind Analytics Concepts
Overview of Analytics and Attribution
Filters and Hyperlinks
Using the Engagement Trending Report
Analytics Reporting: Salesforce Custom Column Filter Support
Using Tags to Organize Your Lists
Attribution Overview - Campaign Performance Table
Using Campaign Lists in Dashboards
Using Company Lists in Dashboards
CaliberMind Metrics Definition
Product Attribution Dashboard
Self-Hosting CaliberMind AnalyticsJS
ROI
Revolutionizing Marketing ROI: CaliberMind's Innovative New Approach
Return On Ad Spend Dashboards
Revenue Contribution Reports Summary
Channel ROI Overview
Creating and maintaining a custom advertising budget for ROAS
Best Practices for Tracking Return-on-Ad-Spend (ROAS)
Why Is CaliberMind ROAS or ROI Different Than My Ad Platform?
Campaign ROI Overview
Budget for ROI Channel Reporting
Attribution Models
Funnels
Funnels 101
Funnels - Start Here!
Marketing & Sales Funnel Foundations
What is a Marketing Funnel?
Sales Funnel Journey: Questions and Answers
Common Funnel Issues
Sales Funnel Glossary
Funnel Stage Definitions
Funnel Terms and Concepts
What is the difference between an Active Journey and a Journey?
In-App Funnels
Funnel Overview: Summary Tab
Funnel Overview: Progression Tab
Funnel Overview: Cohort Tab
Funnel Overview: Stage Analyzer Tab
Funnel Overview: Comparison Tab
Funnel Overview: Journeys Tab
Insights Funnels
Funnel Stages Configuration and Stage Definitions
Funnel Configuration
Funnels FAQs Technical Documentation
Funnel Trigger Events Dashboard
Funnel Company Inclusion Configuration
Event Explore for Funnels
Funnel History Event Configuration
What channels move journeys through a given stage?
Funnel Trend Dashboard
How can I see the number of journeys in or passing through a funnel stage during a period of time?
Sales Funnel Metrics
What touches are influencing each step in the funnel?
How do I see the first event (or "tipping point") in each stage of my funnel?
Funnel Events Technical Documentation
Funnel Static Event Configuration
What is a Starter Funnel?
Funnel Person Inclusion Configuration
Funnel Cohort Analysis Dashboard
Where are my customers stuck in journeys?
Funnel Cohort Analysis Use Cases
Funnel Data Explore Dashboard
Use Cases for Funnels
How do I know the last event that happened before a journey stage change?
How do I identify stage conversion rates?
Funnel Person Status Exits
Introducing CaliberMind's Funnels
Funnels - Lead, Contact, Account, Opportunity Statuses and Stages
Pressure Event Dashboard 101
Demand Generation Funnel Dashboard
Engagement and ABM
Engagement Scoring
Model Configuration
Customize Engagement Scoring Models - Start Here!
Engagement Scoring Models Overview
How to Change Event Touch Scores
How to Add or Change Engagement Score Multipliers
Add or Change Engagement Score Filters
Create Multiple Engagement Score Models
Which touches and events are we scoring?
Sales Opportunity Data Model
Engagement Scoring Time Decay - How It Works & How to Change It
Custom Attribution Configuration - Custom Weighting
Using Engagement Score to Trigger an Update in Salesforce
Default ABM Scoring Logic
Engagement Reporting
Engagement: Summary Tab
Engagement Overview: Companies Tab
Engagement Overview: People Tab
Engagement Overview: Campaigns Tab
Engagement Overview: Explore Tab
Company Engagement AI Summary
Account-Based Marketing Reports
Linking to CaliberMind Reports in Salesforce
ABM Best Practices
Account-to-Lead (A2L) Matching
Lead-to-Account Matching (L2A)
Pushing CaliberMind ABM Scoring Fields to Salesforce.com
3rd Party Intent Signals with Bombora
Tutorials and Use Cases
Digital Marketing Terminology
Customizing Report Visibility (Show/Hide)
How to Manage Your Offsite Events Using CaliberMind
How can I manage my BDR/SDR team activities with CaliberMind?
Combining Engagement Score with Attribution
Enabling the Sales Teams to see the Entire Buyers Journey
How Can I Identify High Risk Opportunities?
How does Sales leverage CaliberMind? Some key use cases.
Running a Sales/Pipeline Review with CaliberMind
How Is CaliberMind Different From My CRM Attribution?
CRM Campaign Member Status and Campaign Response Best Practices
How Do I Optimize Advertising Spend?
Campaign Best Practices Across Systems
How do I use CaliberMind to shorten our sales cycle?
Answering Business Questions Using CaliberMind Reports
Which of my leads are the most engaged?
How Do I Know If a Campaign Is Good or Bad?
How to Flatten Your Campaign Structure in Salesforce
- All Categories
- Attribution
- ROI
- Revolutionizing Marketing ROI: CaliberMind's Innovative New Approach
Revolutionizing Marketing ROI: CaliberMind's Innovative New Approach
Measuring the Return on Investment (ROI) of marketing costs often means wrangling data from multiple advertising platforms, incomplete details about campaign costs and uncertainty about the impact of recent strategies on overall pipeline contribution.
CaliberMind’s Brand New ROI report has been completely reimagined from the ground up to provide insights, and answer questions that were previously difficult to resolve. The newest ROI report simplifies historical ROI analysis and surfaces real-time, actionable insights for optimizing budgets across marketing channels and campaigns.
The key innovations that make these new reports work include: a brand new interface that allows customers to manually input budgets for any channel; and a unique take on the concept of a lookback window that will allow users to shorten the feedback loop between dollars invested and dollars attributed. Shortening the feedback loop makes it possible to compare performance over time for campaigns regardless of how recently the dollars were invested.
CaliberMind Customers can now easily answer questions such as:
- What was my ROI for certain channels the past 2 quarters?
- How is that changing over time?
- What’s working? What’s not?
- What channels are improving?
- and most importantly… Where should I invest my next dollar?
The New ROI User Interface
Previously ROI calculations were limited to the cost data that ad platforms could pull in. Pulling this data from ad platforms is unwieldy and tracking hidden costs for other channels is often a challenge for marketers.
For example, A company spending $60,000 a year on their marketing automation platform previously would not be able to measure the ROI of the email channel. CaliberMind allows you to input the cost of a company's MAP, and can even allocate dollars for the cost to manage it.
Users now have access to a consolidated platform to measure the ROI of marketing efforts. This eliminates the tedious process of extracting data from attribution tools, transferring it to spreadsheets, adding cost data separately, and repeating the entire process for minor filter adjustments.
A Shorter Feedback Loop
In a standard B2B attribution deployment there is often a look-back window of 365 days or longer. This means that ROI numbers can change for up to a year after the initial investment is made. Making this muddier, until a year after the investment has been made, marketers could not compare numbers reliably as numbers from different dates were likely to change, and do so at different rates.
CaliberMind has reimagined the lookback window as a lookahead window that marketers can adjust during analysis, making it easier to evaluate channel performance over different windows of time instead of waiting until the end of a calendar period to analyze. This can all be done without having to update the lookback window that used in existing attribution reports.
New Concepts in ROI
Touch Date Aggregation
Calibermind’s approach to dates has evolved considerably over the past 2 years. Most legacy reports were based on opportunity creation or close dates. Insights reports allow users to toggle between opportunity creation date, opportunity close date and event (touch) dates.
New ROI reporting offers a streamlined approach to date selection in order to provide clear, actionable insights into channel and campaign performance. The reports in the new ROI dashboard are based on Touch date (or event date) and the date of marketing investment.
For example: A company invests $10,000 into a campaign in January, and then an additional $1,000 in both February and March. That campaign yields 100 touches in January and 0 touches in both February and March. In February those 10 touches from January are assigned attribution totaling $25,000, and then in March another 10 touches from January are assigned attribution totaling $25,000.
Using the opportunity create date, the math looks like:
Month | ROI | Attribution | Cost |
January | 0X | $0 | $10,000 |
February | 25X | $25,000 | $1,000 |
March | 25X | $25,000 | $1000 |
Using touch dates the math looks like:
Month | ROI | Attribution | Cost |
January | 5x | $50,000 | $10,000 |
February | 0x | $0,000 | $1,000 |
March | 0X | $0,000 | $1,000 |
If these numbers are aggregated quarterly the math becomes identical, but viewing legacy reports on a monthly basis might lead a user to conclude the campaign over performed in February and March while under performing in January, when in reality the opposite was true. That delay can be very problematic, and as such the new ROI reports (and the reports in insights) are only aggregated based on touch date.
ROI Lock/Look Ahead
The expected long delay between budget spend and user interaction makes it impossible to compare how ROI changes over time. By default, CaliberMind uses a 365 day look-back window, meaning that from the date attribution is assigned, touches are eligible attribution if they happened in the 365 days prior. That means ROI numbers based on touch date can continue to increase for up to one year after the touch happened which is often too late for marketers to evaluate ad strategy.
To shorten this feedback loop, we can configure ROI reports with a “look ahead” period that you input as number of days. Think of the look ahead period as the inverse of the look-back window. For example, if you select a look ahead period of 90 days, that means that solely for the purpose of calculating ROI, attribution is assigned during the first 90 days after the touch happened. Attribution will continue to be assigned in CaliberMind’s system for other reports, but it won’t be factored into the ROI calculation.
When more time than the look ahead window has passed for a given date, we call that date locked. Locked means that, with few exceptions, ROI will NOT increase in a meaningful way over time as new attribution is assigned since no new attribution can be factored into the calculation. For date periods where enough time has NOT yet passed, we call those periods unlocked.
A shorter feedback loop allows you to compare more recent ROI data over time. By setting a look-ahead window to 90 days, you can look at data from 91 to 180 days ago and compare it. Since all dates in 91 to 180 days ago period are locked, we can compare channels or campaigns in an “apples-to-apples way.”
Top Down ROI
Top Down ROI is a new concept in CaliberMind. Along with these new ROI dashboards, CaliberMind has created a Channel Budget input feature. This allows customers to input cost data for various channels. This is a free form entry that allows users to input whatever cost they want for each channel, giving users flexibility and control of budgeting scenarios.
In the past Cost data in CaliberMind was limited to what could be pulled in from existing datasets. This meant cost data was limited to campaigns pulled from CRMs and from ad platforms such as Google and Linkedin. By allowing users to input costs as they choose, they account for channels where cost data doesn’t exist (ex the cost of an annual subscription to Marketo) and if desired include management costs (ex employee salaries).
Bottom Up ROI
Bottom Up ROI is ROI where cost data is based exclusively on cost data pulled from data connectors, and is the traditional way costs were calculated.
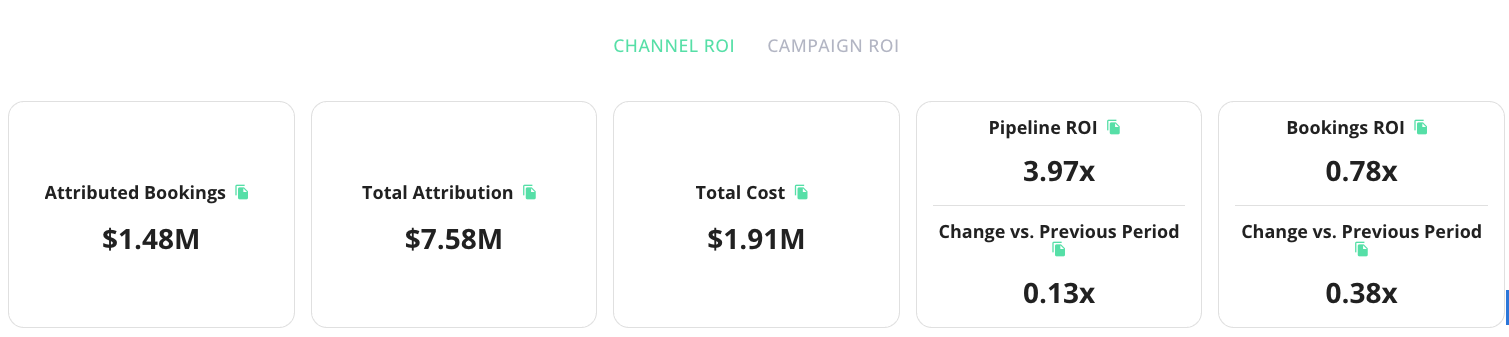
Get Started with New ROI Reporting
The new CaliberMind ROI dashboard empowers users to analyze marketing performance by channel or by campaign. Here's how each differs: