System Overview
Getting Started
New to CaliberMind - Start Here!
How do I use CaliberMind's search functionality?
Company or Account Detail - Search Results
Campaign Detail - Search Results
Person Detail - Search Results
Opportunity Detail - Search Results
How Does CaliberMind Define a "Channel"?
What Is a CaliberMind Event or Event Table?
How to use Dashboards
CaliberMind Home Page - Updated
Quick Link Bookmarks
Connectors / Integrations
CaliberMind Connectors - Start Here!
Adding Your First Connector
CaliberMind Connectors
How to Connect: Act-On
How To Connect: AdRoll / RollWorks
How to Connect: G2, Bombora, or 6sense
How to Connect: Google Ads [via FiveTran]
How To Connect: Google Analytics
How to Connect: Google Sheets
How To Connect: HubSpot
How to Connect: Klaviyo [via FiveTran]
How To Connect: LinkedIn Ads
How To Connect: Marketo
How To Connect: Microsoft Dynamics
How To Connect: Outreach
How to Connect: Pardot [via FiveTran]
How to Connect: Salesforce [via FiveTran]
How to Connect: Segment [via FiveTran]
How to Connect: Twitter [via FiveTran]
How to Connect: ZoomInfo / DiscoverOrg
How To Connect: Google Campaign Manager 360
Kickfire
Setting Up the LinkedIn Push Connector
Setting Up the Salesforce Push Connector
How to Connect: Slack
Power BI/ Tableau/ Looker Connectors Article
Connecting Your Data Warehouse to CaliberMind - Start Here!
Connecting Tableau to CaliberMind
CaliberMind Data Export to Google Cloud Storage
Ingesting CaliberMind Data Into Snowflake
Pushing CaliberMind Person Engagement Data to Salesforce
Integrations Appendix by Connector
SFTP Connector - Updated 2021
Replicating CaliberMind Attribution Data to Salesforce
How to Connect Facebook Ads
How To Connect: Google Search Ads 360
KickFire De-Anonymization in CaliberMind
Field History SFDC Limits (Salesforce)
SFTP Synced Files - Making a Data Change
Connections - Email Notifications
CaliberMind Data Access FAQs
Microsoft Bing Connector [via FiveTran]
Connector Health and Web Tracker Health reports
Connectors Status Page
In-App Notifications
CaliberMind IP Addresses for Whitelisting
Developer Guide
Developer Guide - Start Here!
CaliberMind Entity Relations and System Tables
What is Google BigQuery
CaliberMind Common Data Sources
CaliberMind Identity Levels
System Configuration
Configuring Funnels
How to Set Up and Configure Funnels
Funnel Stages Configuration and Stage Definitions
Funnels FAQs Technical Documentation
Funnel Company Inclusion Configuration
Event Explore for Funnels
Funnel History Event Configuration
Funnel Static Event Configuration
Funnel Person Inclusion Configuration
Funnel Person Status Exits
Object Manager: Campaign Member
How to See Your Object Manager History and Revert Back to Previous Versions
Setting Your Saved Filters for In-App Reporting
Setting Up UTM Mapping in CaliberMind
UTM Parameters Formatting and Best Practices
Standard Channel Logic
Channel Ranking Logic
Custom SQL Data Transformations
Add BigQuery Users within CaliberMind
Remove a BigQuery User within CaliberMind
Adding Custom Columns in Salesforce
How to Email CaliberMind Reports
Setting Up Account Trend Emails
How does CaliberMind normalize the raw data for use?
List Builder
List Builder - Start Here!
What are Lists?
Creating a List Using the List Builder - Step-by-Step Instructions
Use Case Videos - Creating a List Using the List Builder
Importing a List
Downloading a List - Step-by-Step Instructions
Account List Upload - File Requirements
People List Upload - File Requirements
Campaign List Upload - File Requirements
Creating an Account List From a Campaign
Creating Company Lists in List Builder
Creating Company Lists using SQL
How to create a list of all Opportunities that have a very low Engagement
Where is my Segments Menu?
Keyboard Shortcuts using SQL
Web Tracker Installation & Settings
Web Tracker and Installation Settings - Start Here!
Installing AnalyticsJS (CaliberMind snippet)
Two ways to identify prospects that submit a form containing email address using AnalyticsJS
Install AnalyticsJS on a HubSpot website
Using AnalyticsJS Identify on embedded Hubspot forms
Using AnalyticsJS Identify on embedded Marketo forms
Types of Analytics.js Calls
Analytics.JS Overview
Using Analytics.js to Track Web and Product Events
How Cookie Settings Affect the Analytics.JS Tracking Script
Google Tag Manager (GTM) Ad Blockers
Using AnalyticsJS with Drift
Using AnalyticsJS with Qualified
How to check your AnalyticsJS implementation
Identify users using Intercom Messenger
Flows
CaliberMind's Most Popular Flows | Automations
How to use QuickFlows
Flows Status Page
Merge records in Salesforce CRM
Add a Quick-Flow to Salesforce Campaign
Using ClearBit Flows
Setting Up Workflow - Lead Deduplication
ZoomInfo - Add-to/Enrich your database
Setting Up Workflow - Website Repair
Setting Up Workflow - Account Deduplication
Creating Sales Campaigns from Salesloft and Outreach Activities
Setting Up Workflow - Contact Deduplication
Campaigns
Campaigns - Start Here!
Custom Programs for Campaigns
Campaign-Program Membership
Custom Campaigns
Program Logic for Campaigns
Setting Up Answers
Setting Up Answers - Start Here!
Using CaliberMind Answers to Understand Campaign Performance
Using CaliberMind Answers to Understand Account Engagement
Using CaliberMind Answers to Understand Funnel Performance
Using CaliberMind Answers to Understand Funnel Impact
Using CaliberMind Answers to Understand Funnel Flow
Ask Cal Custom AI Answer
Ask Cal Custom Answers: Use Cases
User Administration & SSO
Administration and SSO - Start Here!
Single Sign On (SSO) Setup
Manage Users - Viewing, Inviting, Updating Users and Roles
User Authentication and Provisioning
CaliberMind Data Warehouse Access in Google BigQuery
CaliberMind Insights Dashboards
Working in Insights
CaliberMind Insights - Browser Requirements
CaliberMind Insights - Sharing Dashboards & User Permissions
CaliberMind Insights - Navigating to Insights/Dashboard
CaliberMind Insights - Using Dashboards
CaliberMind Insights - Dashboard Refresh Schedule
CaliberMind Insights - Application Concepts and Terminology
CaliberMind Insights - Filters & Aggregation Type
Building Dashboards - Insights
Attribution Dashboards - Insights
Insights - Attribution - Start Here!
Insights - Attribution Terminology and Key Concepts
Insights - Attribution Overview Dashboard 2.0
Engagement Dashboards - Insights
Insights - Engagement - Start Here!
Insights - Engagement - Dashboard Terminology & Key Concepts
Insights - Engagement Overview
Insights - Engagement - System Account Detail
Insights - Engagement - Person Detail
Build Insights Dashboards - Start Here!
Creating a Custom Pipeline Dashboard (VIDEO)
CaliberMind Insights - Creating Custom Dashboards
Build Your Own Insights Pipeline Dashboard
Building Formulas with Functions
Insights - ROAS Dashboard Use Cases
Creating and Editing a Widget Formula
Using Conditional Statements
How is CaliberMind ROAS Reporting Different than Insights ROI?
Insights - ROI - Start Here!
How to Create a Filter Bookmark
Create Date Range Filters - Step-by-Step
Creating Formulas Based on Criteria and Conditions (Filters)
Insights Data Connector Health Dashboard
Dashboard Function Reference
Introduction to Formulas - Start Here!
Insights Web Tracker Health Dashboard
Using Quick Functions
Insights - ROAS Terminology & Key Concepts
Insights Engagement Dashboard - Aggregation Dates
Filters
Object Mapping for Filters - Start Here!
Custom Configuration for Object Mapping
Object Mapping Filters
How to Map Your Salesforce Opportunity Revenue Field
Object Mapping: Create a Filter
Object Mapping: Create a Mapping
Object Mapping: Create a Replacement
Object Mapping: Create a Campaign Substitution
Filters Update for Creating Filter Sets
Filter Drawer Definitions
CaliberMind Sandbox
GDPR Compliance with CaliberMind
Data Dictionary
Attribution
Analytics
Attribution
Attribution Overview: Summary Tab
Attribution Overview: Comparisons Tab
Attribution Overview: Explore Tab
Attribution Overview: Opps Tab
Attribution Overview: People Tab
Attribution Overview: Events Tab
Campaign Types: Best Practices for Easy-to-Read Attribution
Virtual Campaigns in CaliberMind
Attribution - CaliberMind versus Embedded Attribution in Salesforce?
Removal effect with a Markov chain model
Attribution Reports Summary
Demand Generation
Data Integrity
Customer Success
Understanding Reports
CaliberMind Analytics Concepts
Overview of Analytics and Attribution
Filters and Hyperlinks
Using the Engagement Trending Report
Analytics Reporting: Salesforce Custom Column Filter Support
Using Tags to Organize Your Lists
Attribution Overview - Campaign Performance Table
Using Campaign Lists in Dashboards
Using Company Lists in Dashboards
CaliberMind Metrics Definition
Product Attribution Dashboard
Self-Hosting CaliberMind AnalyticsJS
ROI
Revolutionizing Marketing ROI: CaliberMind's Innovative New Approach
Return On Ad Spend Dashboards
Revenue Contribution Reports Summary
Channel ROI Overview
Creating and maintaining a custom advertising budget for ROAS
Best Practices for Tracking Return-on-Ad-Spend (ROAS)
Why Is CaliberMind ROAS or ROI Different Than My Ad Platform?
Campaign ROI Overview
Budget for ROI Channel Reporting
Attribution Models
Choosing the Right Attribution Model
Attribution Models: First-Touch
Attribution Models: W-Shaped
Attribution Models: Middle
Chain-Based Attribution Model
The A-Shaped Model
Configurable Widgets
Ad Performance Report - Summary Tab
Ad Performance Report - Attribution Tab
Funnels
Funnels 101
Funnels - Start Here!
Marketing & Sales Funnel Foundations
What is a Marketing Funnel?
Sales Funnel Journey: Questions and Answers
Common Funnel Issues
Sales Funnel Glossary
Funnel Stage Definitions
Funnel Terms and Concepts
Sales Funnel Metrics
What is the difference between an Active Journey and a Journey?
In-App Funnels
Funnel Overview: Summary Tab
Funnel Overview: Progression Tab
Funnel Overview: Cohort Tab
Funnel Overview: Stage Analyzer Tab
Funnel Overview: Comparison Tab
Funnel Overview: Journeys Tab
Insights Funnels
Funnels Use Cases
What channels move journeys through a given stage?
How can I see the number of journeys in or passing through a funnel stage during a period of time?
What touches are influencing each step in the funnel?
How do I see the first event (or "tipping point") in each stage of my funnel?
Where are my customers stuck in journeys?
How do I know the last event that happened before a journey stage change?
How do I identify stage conversion rates?
Funnel Configuration - Insights
Funnel Trigger Events Dashboard
Insights Funnels Reports Explained
Funnel Trend Dashboard
What is a Starter Funnel?
Funnel Cohort Analysis Dashboard
Funnel Cohort Analysis Use Cases
Funnel Data Explore Dashboard
Introducing CaliberMind's Funnels
Funnels - Lead, Contact, Account, Opportunity Statuses and Stages
Pressure Event Dashboard 101
Demand Generation Funnel Dashboard
Engagement and ABM
Engagement Scoring
Model Configuration
Customize Engagement Scoring Models - Start Here!
Engagement Scoring Models Overview
How to Change Event Touch Scores
How to Add or Change Engagement Score Multipliers
Add or Change Engagement Score Filters
Create Multiple Engagement Score Models
Which touches and events are we scoring?
Sales Opportunity Data Model
Engagement Scoring Time Decay - How It Works & How to Change It
Custom Attribution Configuration - Custom Weighting
Using Engagement Score to Trigger an Update in Salesforce
Default ABM Scoring Logic
Recommended Weights for Engagement Scores
Engagement Reporting
Engagement: Summary Tab
Engagement Overview: Companies Tab
Engagement Overview: People Tab
Engagement Overview: Campaigns Tab
Engagement Overview: Explore Tab
Company Engagement AI Summary
Account-Based Marketing Reports
Linking to CaliberMind Reports in Salesforce
ABM Best Practices
Account-to-Lead (A2L) Matching
Lead-to-Account Matching (L2A)
Pushing CaliberMind ABM Scoring Fields to Salesforce.com
Slack AI Company Engagement Summary
3rd Party Intent Signals with Bombora
Tutorials and Use Cases
Digital Marketing Terminology
Customizing Report Visibility (Show/Hide)
How to Manage Your Offsite Events Using CaliberMind
How can I manage my BDR/SDR team activities with CaliberMind?
Combining Engagement Score with Attribution
Enabling the Sales Teams to see the Entire Buyers Journey
How Can I Identify High Risk Opportunities?
How does Sales leverage CaliberMind? Some key use cases.
Running a Sales/Pipeline Review with CaliberMind
How Is CaliberMind Different From My CRM Attribution?
CRM Campaign Member Status and Campaign Response Best Practices
How Do I Optimize Advertising Spend?
Campaign Best Practices Across Systems
How do I use CaliberMind to shorten our sales cycle?
Answering Business Questions Using CaliberMind Reports
Which of my leads are the most engaged?
How Do I Know If a Campaign Is Good or Bad?
How to Flatten Your Campaign Structure in Salesforce
- All Categories
- System Overview
- Setting Up Answers
- Using CaliberMind Answers to Understand Funnel Flow
Using CaliberMind Answers to Understand Funnel Flow
Most businesses organize their sales and marketing practices around the idea of a funnel. The general hope is that more leads coming into the top will lead to more customers coming out of the bottom. Monitoring and understanding the various parts of a company's funnel is an essential practice for sales and marketing professionals in order to understand what worked, what didn’t, and how things are going right now.
One of the most challenging parts of this analysis is teasing out the large-scale patterns found in the overall flow of the funnel. Developing a macro-level understanding of how potential customers flow through a funnel is typically step one to improving marketing tactics, operational practices, and overall strategy. These include getting an idea of big questions like:
- Where do successful journeys start?
- Where do things get stuck?
- What characterizes my customers’ journey?
- Are there any operational issues with my funnel setup?
With CaliberMind Answers, we aim to make it easy for you to develop a macro-view of the nature of your funnel and how it flows.
How Do I Set This Up?
The Funnel Origin Answer within CaliberMind is designed with ease of use and flexibility in mind. With a few simple configuration steps, you can get a picture of how potential customers flow through your funnel.
Below we detail the various configuration options available to users.
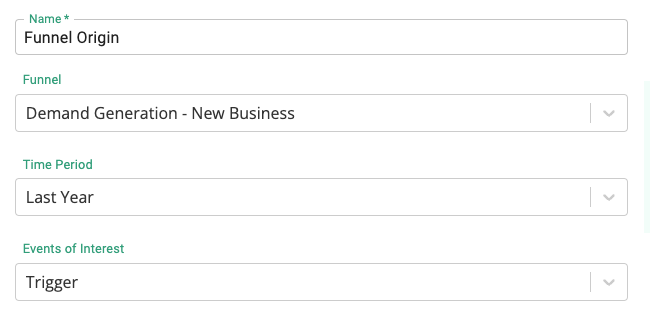
Name (1)
This field allows users to give their answer a unique name in order to quickly identify them across CaliberMind.
Funnel (2)
The name of the funnel the user wants to learn about. These names are defined in the underlying Funnel configuration.
Time Period (3)
This parameter allows users to define the most appropriate time period for analyzing their funnel. Long time ranges, such as This and Last Year, are useful for understanding broad historical trends while shorter time ranges, such as Past 90 Days, are more appropriate for analyzing the impact of recent decisions.
Events of Interest (4)
Funnels within CaliberMind are built upon the concept of an event stream. This event stream is the collection of all visible, relevant interactions potential customers could have with your content, tactics, people, company, or more. Examples include interacting with your website, consuming your podcast, signing up for a demo, booking a meeting, and much, much more. CaliberMind builds an intelligence layer on top of this event stream to automatically progress funnel journeys based on your rules and configuration.Within the concept of funnel flow, we have two main classes of events that could be of interest.
- Trigger Events: These are the events directly tied to rules configured to indicate stage change in a user’s funnel. These could be interaction-based (visited your website, downloaded a white paper, etc.) or operational (updating a status field in Salesforce, changing a timestamp on a field, etc.) in nature.
- Converting Events: Converting events can be thought of as the “last significant event” leading up to a stage change. Significant events are typically defined as attribution-eligible inbound interactions.
The distinction between these two event classifications can be subtle but important. Consider the following example.
A potential customer has booked a demo. The meeting was a success and it seems that this could be a real potential buyer. Following that meeting, your salesperson changes a field in the CRM to mark that as a Sales Accepted OpportunityIn this case, the trigger and converting events would be:
- Trigger Event: The act of updating the CRM to change the status.
- Converting Event: The last significant inbound event associated with the account. In this case that would probably be booking the demo.
In most cases, converting events represent the events of interest to marketers. In many cases, the converting and trigger events are the same. This is particularly true when users have significant visibility and automation for their top-of-funnel process. Trigger events are primarily useful in understanding the overall operational dynamics of a funnel implementation.
Include Backfills (5)
The typical conceptual view of a funnel is a linear path progressing through all stages from start to finish, checking each stage’s criteria along the way. However, this is often not the case in practice. Several factors could lead to customers starting their journeys in later stages as well as potentially skipping stages. Within the CaliberMind Funnel system, we have a concept of backfill events. These events are used for bookkeeping purposes when these peculiarities occur.
This parameter controls whether or not backfills are included in the resulting Answer. When backfills are included, users get a full picture of how things are moving through their funnel as well as which stages may have operational issues. The downside of this is that backfills increase the potential complexity of the underlying data, which some users may feel take away from their ability to understand large-scale patterns.
We recommend enabling backfills as a starting point for using this Answer.
Include Early Terminations (6)
Within a user’s funnel, the majority of journeys end prior to completion. CaliberMind automatically captures and classifies these terminal outcomes based on the user’s configuration. This parameter toggles on or off the inclusion of these early terminations in the resulting Answer. Choosing to disable these is primarily done to reduce visual complexity and enable ease of use.
Only Include Completions (6)
This parameter is used to control whether all funnel journeys over the given time period are considered or just those that successfully completed. Similar to the Early Termination and Backfill configuration, this option is selected when users want to reduce complexity and only care about understanding what characterizes successful journeys.
How Do I Use This?
Once you have set up your Answer, you will have access to a curated exploration page focused solely on your version of the question at hand. This is in addition to the generated insight that is delivered to you. This page provides both high-level and deeper insight into your data. The screenshot and breakdown below provide supplementary information about using and interpreting this information.


Answer Name and Configuration Panel (1)
This section provides the current configuration for this Answer. Often times this information is useful in differentiating use cases and providing additional context for discussion.
Answer (2)
Rather than just give users a multitude of reports to wade through, CaliberMind aims to provide a curated experience for understanding and interpreting the data at hand. This section provides a high-level answer to the core underlying question being considered. This statement is limited to 1-2 lines of concise information. This is the same value that is listed on the My Answers page for this specific question.
This specific Answer tells you the most common origin for successful funnel journeys within the time frame that was specified.
Journey Sankey Diagram (3)
This Sankey diagram represents the flow of all journeys through a given funnel over the configured time range. These diagrams are useful in visualizing large-scale patterns in flow. Some key details about this diagram are:
- Journeys flow from left to right (top of funnel to completion)
- The nodes are characterized by two pieces of information. First, the underlying event type for either the converting or trigger event (depending on the stage). Secondly, the stage number is appended to the event type to distinguish between things happening at different points in the funnel.
- Ex: Content Download_3 refers to Content Download events that led to the transition into the third stage of a given funnel.
- When backfills are enabled, each vertical slice from left to right corresponds to only a single stage starting with Stage 1. When backfills are not enabled, vertical alignment does not hold for stage designation due to journeys being able to skip stages.
- Nodes and paths that are colored gold mean that at least one journey passed through this route on the way to a successful completion. This helps visualize a potential “golden path” through a user’s funnel. Often the dynamics of a user’s funnel are too complex for a straightforward single best path to make sense, but this visualization still helps to understand where success flows through.
- The size of the links between nodes is proportional to the number of journeys that follow that path.
- Nodes can be dragged within their vertical slice to enhance visibility.
- Nodes can be clicked on to explore additional information about inflow and outflow. The sections below provide more detail on this information.
Node Breakdown (4)
This table is reactive to whatever node has been selected by the user. The goal of this table is to provide an additional layer of detail about the composition of events tied to a specific node.
The table contains the following data:
- Event Name: The specific event name associated with the current node. Depending on the underlying event type and a user’s data configuration, a node could represent a wide array of specific events. Alternatively, a node could represent a number of common, generic events used to flag behavior.
- # of Completed Journeys: A count of all the successful journeys that traveled through this specific event name within this node.
- # Active: This is a count of all the current (within the context of the configured time range) journeys that have passed through this event name.
- # Exits: This is a count of the total number of journey exits associated with this event name and node.
- Furthest Stage Reached: This is the name of the furthest stage reached by journeys that have moved through this combination of event name and node.
- Furthest Stage Order: This is the order of the furthest stage reached by journeys that have moved through this combination of event name and node.
Inbound Breakdown (5)
This pie chart shows the percentage breakdown of source nodes from the previous stages that lead to the user-selected node. This widget is reactive to the user’s selection on the Journey Sankey diagram.
Outbound Breakdown (6)
This pie chart shows the percentage breakdown of destinations for journeys that pass through the user-selected node. This widget is reactive to the user’s selection on the Journey Sankey diagram.