Table of Contents
Using CaliberMind Answers to Understand Campaign Performance
 Updated
by Angie C.
Updated
by Angie C.
Using CaliberMind Answers to Understand Campaign Performance
A common task that marketers have on their plate is to monitor and manage various campaigns. “What are my top campaigns?” is a common question that these professionals have to deal with almost daily. These campaigns can vary dramatically in cost, platform, type, and other factors, making this process complicated and demanding. Another question may be, “How has my campaign's performance changed in the last quarter?"
Within CaliberMind Answers, we aim to make it easy for you to get a high-level look at your top-performing or underperforming campaigns.
How Do I Set This Up?
The Campaign Performance Answer within CaliberMind is designed with ease of use and flexibility in mind. With a few simple configuration steps, you will be able to have automated insights generated about your top campaigns across a variety of metrics.
Below we detail the various configuration options available to users.
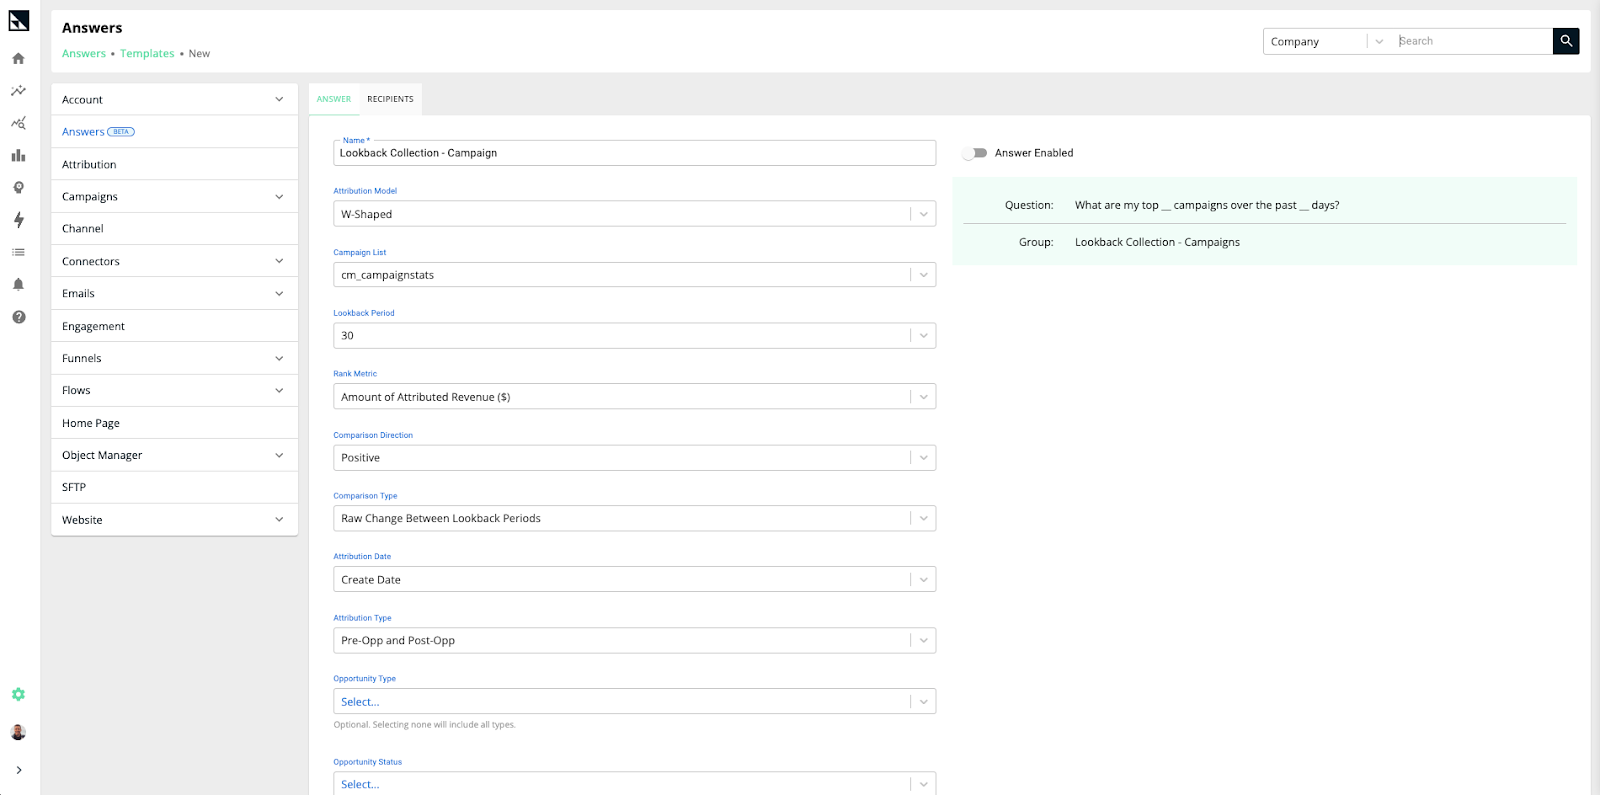
- Name: This field allows users to give their answer a unique name in order to quickly identify them across CaliberMind.
- Attribution Model: We currently support ranking campaigns based on various attribution-related measures. Users can configure their Answer to use any of their enabled attribution models. For users without a preference in their attribution model, we recommend using the even weighted option where available.
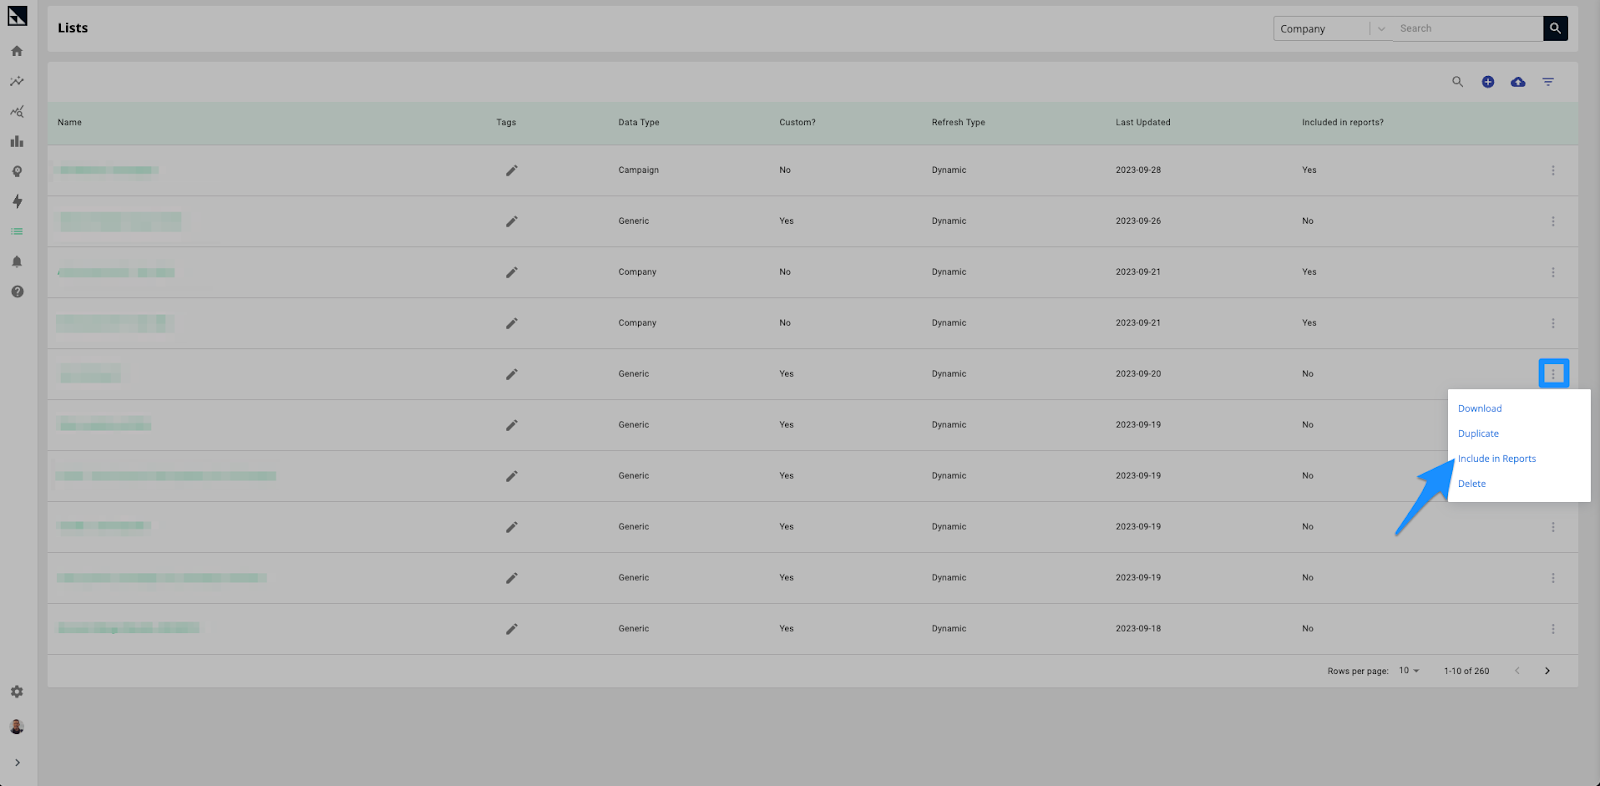
- Campaign List: For scenarios where a user wants to limit the collection of campaigns being considered, we support filtering based on predefined CaliberMind Lists. By default, we consider all observed active campaigns in a user’s system by selecting the cm_: option. More information about Lists can be found here in this KB article.
- Lookback Period: Users often want to consider different time periods when evaluating the performance of their campaigns. For this Answer, we allow users to define an arbitrary number of days in the past to define their current and previous periods. The example below illustrates how current and previous periods are calculated. As a default, we suggest users set this to 30 days as a balance between short and long-term behavior.
Example:
For a lookback period of 30 days, the current and previous periods would be defined as:- Current Period: All days between today and 30 days prior.
- Previous Period: All days between 31 and 60 days prior to today.
- Rank Metric: Currently, this Answer supports ranking campaign performance over a given period by one of the following metrics:
- Amount of Attributed Revenue ($): This metric measures campaigns based on the amount of attribution associated with them over their current and previous periods. This is one of the standard marketing measures used to understand campaign performance.
- # of People With Attribution: This metric measures campaigns based on how many distinct people interacted with a campaign during their current and previous periods. This metric can be used to gain insight into the reach and penetration of campaigns, even if they don’t have much direct revenue tied to them yet.
- % of All People with Attribution (i.e. % of Overall Touches): This metric ranks campaigns based on the overall proportion of attribution-eligible people observed. This can be useful for trying to measure the efficiency of campaigns and if any specific campaigns seem to be responsible for an outsized portion of interest.
Comparison Direction: This parameter controls whether the top or bottom rankings are returned. Selecting Positive will yield the top-performing campaigns based on ranking metrics and comparison type. Selecting Negative will yield the worst-performing campaigns based on the same configuration. Depending on the use cases, both top and bottom performers can yield insight into your overall marketing efforts.
- Example:
What are my top-performing campaigns by attributed revenue over the past 30 days?
What are my campaigns that have seen the largest drop in attributed revenue over the past 90 days?
Comparison Type: This parameter controls how a given rank metric is calculated in relation to the current and previous periods. The currently supported comparison types are listed below.
- Total Within Lookback Period: This method looks solely at the rank metric value within the given look-back period.
Example:
- What are my top campaigns based on how much attributed revenue they generated in the past 30 days?
- What are my best-performing campaigns based on how many people saw them in the past 7 days?
- Raw Change Between Lookback Periods: This method compares the rank metric for the current and previous periods and ranks the campaigns based on total change.
Example:
- Which campaigns improved most over the past 30 days based on how many people saw them?
- Which campaigns saw the most drop off in attributable revenue over the past 90 days?
- % Change Between Lookback Periods: Similar to the previous method, this method ranks campaigns based on the change in their metric between the current and previous periods. The difference here is that the change is represented as a percentage increase rather than the raw difference. This highlights campaigns that saw large changes relative to their original value.
Example:
- Which campaigns saw the largest proportional change in the number of people with attribution over the past 30 days?
- Which campaigns saw the largest relative decrease in the amount of attributable revenue over the past 7 days?
- Which campaigns saw the most drop off in attributable revenue over the past 90 days?
Combining Rank Metric, Comparison Direction, and Comparison Type
The combination of these three parameters controls the nature of the underlying question being answered. The table below details how to select configuration options for some common versions of these questions. For illustrative purposes, assume a lookback period of 30 days.
Question | Rank Metric | Comparison Direction | Comparison Type |
Which campaigns generated the most revenue? | Amount of Attributed Revenue ($) | Positive | Total Within Lookback Period |
Which campaigns generated the least revenue? | Amount of Attributed Revenue ($) | Negative | Total Within Lookback Period |
Which campaigns saw the most improvement in revenue? | Amount of Attributed Revenue ($) | Positive | Raw Change Between Lookback Periods |
Which campaigns saw the largest drop off in revenue? | Amount of Attributed Revenue ($) | Negative | Raw Change Between Lookback Periods |
Which campaigns saw the most relative improvement in revenues? | Amount of Attributed Revenue ($) | Positive | % Change Between Lookback Periods |
Which campaigns saw the largest relative drop off in revenue? | Amount of Attributed Revenue ($) | Negative | % Change Between Lookback Periods |
Which campaigns had the most people with attribution? | # of People With Attribution | Positive | Total Within Lookback Period |
Which campaigns had the fewest people with attribution? | # of People With Attribution | Negative | Total Within Lookback Period |
Which campaigns saw the most improvement in the number of people with attributions? | # of People With Attribution | Positive | Raw Change Between Lookback Periods |
Which campaigns saw the largest drop off in the number of people with attribution? | # of People With Attribution | Negative | Raw Change Between Lookback Periods |
Which campaigns saw the most relative improvement in the number of people with attribution? | # of People With Attribution | Positive | % Change Between Lookback Periods |
Which campaigns saw the largest relative drop off in the number of people with attribution over the past 30 days? | # of People With Attribution | Negative | % Change Between Lookback Periods |
Which campaigns played the largest role in generating people with attribution? | % of People with Attribution | Positive | Total Within Lookback Period |
Which campaigns played the smallest role in generating people with attribution? | % of People with Attribution | Negative | Total Within Lookback Period |
Which campaigns saw the most improvement in their share of people with attribution? | % of People with Attribution | Positive | Raw Change Between Lookback Periods |
Which campaigns saw the largest drop off in their share of people with attribution? | % of People with Attribution | Negative | Raw Change Between Lookback Periods |
Which campaigns saw the most relative improvement in their share of people with attribution? | % of People with Attribution | Positive | % Change Between Lookback Periods |
Which campaigns saw the largest relative drop off in their share of generating people with attribution? | % of People with Attribution | Negative | % Change Between Lookback Periods |
- Attribution Date: This parameter controls the date that is associated with each attribution-eligible event. Ultimately this impacts which time periods various events and activities associated with campaigns fall.
- Create Date: This option ties attribution-eligible events to the date that their associated opportunity was created.
- Close Date: This option ties attribution-eligible events to the date that their associated opportunity was closed.
- Touch Date: This option ties attribution-eligible events to the date that they were originally observed.
- Attribution Type: This option controls which types of attribution are included based on whether they occurred before or after the opportunity. This is often used to try and understand the different types of impact marketing can have on moving opportunities through a pipeline.
- Pre-Opp Only: Only events that occur prior to the opportunity creation are considered. This is often treated as a measure of the impact marketing has on pipeline generation and top-of-funnel activity.
- Post-Opp Only: Only events that occur after the opportunity creation are considered. This is often treated as a measure of the influence marketing has on revenue once opportunities have entered the sales-led portion of the pipeline.
- Pre-Opp and Post-Opp: This is the aggregation of all attribution-eligible events. It is used to understand the total impact of marketing efforts.
- Opportunity Type: This is an optional filter that allows users to limit their Answer to only consider campaigns associated with specific opportunity types. Examples could include types such as “New Business”, “Upsell”, “Renewal”, etc. These values tend to be specific to a customer’s CRM integration and business processes.
- Opportunity Status: This is an optional filter that allows a user to limit their Answer to only consider campaigns associated with opportunities that have a specific current status. By default, all opportunity statuses are included.
- Won: Only opportunities that are closed and successfully won are considered.
- Lost: Only opportunities that are closed but were lost are considered.
- Open: Only opportunities that are currently open are considered.
- Number of Campaigns to Rank: This option controls how many ranked campaigns are returned for further investigation.
How Do I Use This?
Once you have set up your Answer, you will have access to a curated exploration page focused solely on your version of the question at hand. This will give you both high-level and deeper insight into your data. The screenshot and breakdown below provide supplementary information about using and interpreting this information.

- Answer Name and Configuration Panel: This section provides the current configuration for this Answer. Often times this information is useful in differentiating use cases and providing additional context for discussion.
- Answer: Rather than just give users a multitude of reports to wade through, CaliberMind aims to provide a curated experience for understanding and interpreting the data at hand. This section provides a high-level answer to the core underlying question being considered. This statement is limited to 1-2 lines of concise information. This is the same value that is listed on the My Answers page for this specific question.
Additionally, we provide a classification as to whether this answer represents a positive, negative, or neutral outcome.
- Average Attribution Across Top Campaigns: This metric provides the average amount of attributable revenue across the top-ranked campaigns specified by the current configuration. This value is provided for both the current and previous periods.
- Average Touches Across Top Campaigns: This metric provides the average number of occurrences of the top-ranked campaigns specified by the current configuration. of attributable revenue across the top-ranked campaigns specified by the current configuration. This value is provided for both the current and previous periods.
- Campaign Performance Across Lookback Period: This table provides various metrics for the top-ranked campaigns based on the current configurations. Descriptions of the columns of the table are provided below.
Column | Description |
Campaign Name | The name of the campaign. |
Campaign Type | The type of the campaign. |
Total Attribution | The total attribution generated by the campaign within the current period. For example, if the lookback period is set to 30 days this would be the total attribution tied to the campaign over the past 30 days. |
Total Attribution (Previous Period) | The total attribution generated by the campaign within the previous period. For example, if the lookback period is set to 30 days this would be the total attribution tied to the campaign between 31 and 60 days ago. |
% Difference Total Attribution | The relative change in attribution between the current and previous period. For example, if $10,000 was generated in the previous period and $15,000 was generated within the current period, that would yield a 50% change. |
Total Touches | The total number of times this campaign showed up connected to attribution-eligible events within the current period. |
Total Touches (Previous Period) | The total number of times this campaign showed up connected to attribution-eligible events within the previous period. |
% Difference Total Touches | The relative change in total touches between the current and previous period. For example, if a campaign saw 20 attribution-eligible events previous period and 10 attribution-eligible events during the current period, that would result in a -50% change. |
% Overall Touches | The share of all distinct people who show up within the current period that is tied to a given campaign. For example, if 100 distinct people were observed across all campaigns and 25 of them showed up in Campaign A, then Campaign A would have a 25% share. |
% Overall Touches (Previous Period) | The share of all distinct people who show up within the previous period that is tied to a given campaign. For example, if 100 distinct people were observed across all campaigns and 25 of them showed up in Campaign A, then Campaign A would have a 25% share. |
Difference in % Overall Touches | The raw difference between the share of distinct people who show up between the current and previous period. For example, if Campaign A has a 25% share in the current period and a 10% share in the previous period, that would be a difference of 15%.Note: It is easy to confuse this metric with the relative differences of previous metrics. We avoid displaying percentage-change of percentage metrics in order to avoid undue confusion. |