System Overview
Getting Started
New to CaliberMind - Start Here!
CaliberMind Home Page & Navigation
Signing In to CaliberMind
How do I use CaliberMind's search functionality?
Company or Account Detail - Search Results
Campaign Detail - Search Results
Person Detail - Search Results
Opportunity Detail - Search Results
How Does CaliberMind Define a "Channel"?
What Is a CaliberMind Event or Event Table?
How to use Dashboards
Connectors / Integrations
CaliberMind Connectors - Start Here!
Overview of Connectors
Adding Your First Connector
CaliberMind Connectors
How to Connect: Act-On
How To Connect: AdRoll / RollWorks
How to Connect: G2, Bombora, or 6sense
How to Connect: Google Ads [via FiveTran]
How To Connect: Google Analytics
How to Connect: Google Sheets
How To Connect: HubSpot
How to Connect: Klaviyo [via FiveTran]
How To Connect: LinkedIn Ads
How To Connect: Marketo
How To Connect: Microsoft Dynamics
How To Connect: Outreach
How to Connect: Pardot [via FiveTran]
How to Connect: Salesforce [via FiveTran]
How to Connect: Segment [via FiveTran]
How to Connect: Twitter [via FiveTran]
How to Connect: ZoomInfo / DiscoverOrg
Kickfire
Setting Up the LinkedIn Push Connector
Setting Up the Salesforce Push Connector
Power BI/ Tableau/ Looker Connectors Article
Connecting Your Data Warehouse to CaliberMind - Start Here!
Connecting Tableau to CaliberMind
CaliberMind Data Export to Google Cloud Storage
Ingesting CaliberMind Data Into Snowflake
Pushing CaliberMind Person Engagement Data to Salesforce
Integrations Appendix by Connector
SFTP Connector - Updated 2021
Replicating CaliberMind Attribution Data to Salesforce
How to Connect Facebook Ads
KickFire De-Anonymization in CaliberMind
Field History SFDC Limits (Salesforce)
SFTP Synced Files - Making a Data Change
Connections - Email Notifications
CaliberMind Data Access FAQs
Microsoft Bing Connector
Bing/Microsoft Ad's Connector
Connector Health and Web Tracker Health reports
Connectors Status Page
In-App Notifications
CaliberMind IP Addresses for Whitelisting
Developer Guide
Developer Guide - Start Here!
CaliberMind Entity Relations and System Tables
What is Google BigQuery
CaliberMind Common Data Sources
CaliberMind Identity Levels
System Configuration
Object Mapping for Filters - Start Here!
Custom Configuration for Object Mapping
Object Mapping Filters
How to Map Your Salesforce Opportunity Revenue Field
Object Mapping: Create a Filter
Object Mapping: Create a Mapping
Object Manager: Campaign Member
Object Mapping: Create a Replacement
Object Mapping: Create a Campaign Substitution
How to See Your Object Manager History and Revert Back to Previous Versions
Setting Your Saved Filters for In-App Reporting
Setting Up UTM Mapping in CaliberMind
UTM Parameters Formatting and Best Practices
Standard Channel Logic
Channel Ranking Logic
Custom SQL Data Transformations
Add BigQuery Users within CaliberMind
Remove a BigQuery User within CaliberMind
Adding Custom Columns in Salesforce
How to Email CaliberMind Reports
Setting Up Account Trend Emails
List Builder
List Builder - Start Here!
What are Lists?
Creating a List Using the List Builder - Step-by-Step Instructions
Use Case Videos - Creating a List Using the List Builder
Importing a List
Downloading a List - Step-by-Step Instructions
Account List Upload - File Requirements
People List Upload - File Requirements
Campaign List Upload - File Requirements
Creating an Account List From a Campaign
Creating Company Lists in List Builder
Creating Company Lists using SQL
How to create a list of all Opportunities that have a very low Engagement
Where is my Segments Menu?
Keyboard Shortcuts using SQL
Web Tracker Installation & Settings
Web Tracker and Installation Settings - Start Here!
Installing AnalyticsJS (CaliberMind snippet)
Two ways to identify prospects that submit a form containing email address using AnalyticsJS
Install AnalyticsJS on a HubSpot website
Using AnalyticsJS Identify on embedded Hubspot forms
Using AnalyticsJS Identify on embedded Marketo forms
Types of Analytics.js Calls
Analytics.JS Overview
Using Analytics.js to Track Web and Product Events
How Cookie Settings Affect the Analytics.JS Tracking Script
Google Tag Manager (GTM) Ad Blockers
Using AnalyticsJS with Drift
Using AnalyticsJS with Qualified
How to check your AnalyticsJS implementation
Identify users using Intercom Messenger
Flows
CaliberMind's Most Popular Flows | Automations
How to use QuickFlows
Flows Status Page
Merge records in Salesforce CRM
Add a Quick-Flow to Salesforce Campaign
Using ClearBit Flows
Setting Up Workflow - Lead Deduplication
ZoomInfo - Add-to/Enrich your database
Setting Up Workflow - Website Repair
Setting Up Workflow - Account Deduplication
Creating Sales Campaigns from Salesloft and Outreach Activities
Setting Up Workflow - Contact Deduplication
Campaigns
Campaigns - Start Here!
Custom Programs for Campaigns
Campaign-Program Membership
Custom Campaigns
Program Logic for Campaigns
Setting Up Answers
Setting Up Answers - Start Here!
Using CaliberMind Answers to Understand Campaign Performance
Using CaliberMind Answers to Understand Account Engagement
Using CaliberMind Answers to Understand Funnel Performance
Using CaliberMind Answers to Understand Funnel Impact
Using CaliberMind Answers to Understand Funnel Flow
User Administration & SSO
Administration and SSO - Start Here!
Single Sign On (SSO) Setup
Manage Users - Viewing, Inviting, Updating Users and Roles
User Authentication and Provisioning
CaliberMind Data Warehouse Access in Google BigQuery
CaliberMind Insights Dashboards
Working in Insights
CaliberMind Insights - Browser Requirements
CaliberMind Insights - Sharing Dashboards & User Permissions
CaliberMind Insights - Navigating to Insights/Dashboard
CaliberMind Insights - Using Dashboards
CaliberMind Insights - Dashboard Refresh Schedule
CaliberMind Insights - Application Concepts and Terminology
CaliberMind Insights - Filters & Aggregation Type
Building Dashboards - Insights
Attribution Dashboards - Insights
Insights - Attribution - Start Here!
Insights - Attribution Terminology and Key Concepts
Insights - Attribution Overview Dashboard 2.0
Engagement Dashboards - Insights
Insights - Engagement - Start Here!
Insights - Engagement - Dashboard Terminology & Key Concepts
Insights - Engagement Overview
Insights - Engagement - System Account Detail
Insights - Engagement - Person Detail
Build Insights Dashboards - Start Here!
Creating a Custom Pipeline Dashboard (VIDEO)
CaliberMind Insights - Creating Custom Dashboards
Build Your Own Insights Pipeline Dashboard
Building Formulas with Functions
Insights - ROAS Dashboard Use Cases
Creating and Editing a Widget Formula
Using Conditional Statements
How is CaliberMind ROAS Reporting Different than Insights ROI?
Insights - ROI - Start Here!
How to Create a Filter Bookmark
Create Date Range Filters - Step-by-Step
Creating Formulas Based on Criteria and Conditions (Filters)
Insights Data Connector Health Dashboard
Dashboard Function Reference
Introduction to Formulas - Start Here!
Insights Web Tracker Health Dashboard
Using Quick Functions
Insights - ROAS Terminology & Key Concepts
Insights Engagement Dashboard - Aggregation Dates
CaliberMind Sandbox
GDPR Compliance with CaliberMind
Data Dictionary
Attribution
Analytics
Attribution
Attribution Overview: Summary Tab
Attribution Overview: Comparisons Tab
Attribution Overview: Explore Tab
Attribution Overview: Opps Tab
Attribution Overview: People Tab
Attribution Overview: Events Tab
Campaign Types: Best Practices for Easy-to-Read Attribution
Virtual Campaigns in CaliberMind
Attribution - CaliberMind versus Embedded Attribution in Salesforce?
Removal effect with a Markov chain model
Attribution Reports Summary
Demand Generation
Data Integrity
Customer Success
Understanding Reports
CaliberMind Analytics Concepts
Overview of Analytics and Attribution
Filters and Hyperlinks
Using the Engagement Trending Report
Analytics Reporting: Salesforce Custom Column Filter Support
Using Tags to Organize Your Lists
Attribution Overview - Campaign Performance Table
Using Campaign Lists in Dashboards
Using Company Lists in Dashboards
CaliberMind Metrics Definition
Product Attribution Dashboard
Self-Hosting CaliberMind AnalyticsJS
ROI
Revolutionizing Marketing ROI: CaliberMind's Innovative New Approach
Return On Ad Spend Dashboards
Revenue Contribution Reports Summary
Channel ROI Overview
Creating and maintaining a custom advertising budget for ROAS
Best Practices for Tracking Return-on-Ad-Spend (ROAS)
Why Is CaliberMind ROAS or ROI Different Than My Ad Platform?
Campaign ROI Overview
Budget for ROI Channel Reporting
Attribution Models
Funnels
Funnels 101
Funnels - Start Here!
Marketing & Sales Funnel Foundations
What is a Marketing Funnel?
Sales Funnel Journey: Questions and Answers
Common Funnel Issues
Sales Funnel Glossary
Funnel Stage Definitions
Funnel Terms and Concepts
What is the difference between an Active Journey and a Journey?
In-App Funnels
Funnel Overview: Summary Tab
Funnel Overview: Progression Tab
Funnel Overview: Cohort Tab
Funnel Overview: Stage Analyzer Tab
Funnel Overview: Comparison Tab
Funnel Overview: Journeys Tab
Insights Funnels
Funnel Stages Configuration and Stage Definitions
Funnel Configuration
Funnels FAQs Technical Documentation
Funnel Trigger Events Dashboard
Funnel Company Inclusion Configuration
Event Explore for Funnels
Funnel History Event Configuration
What channels move journeys through a given stage?
Funnel Trend Dashboard
How can I see the number of journeys in or passing through a funnel stage during a period of time?
Sales Funnel Metrics
What touches are influencing each step in the funnel?
How do I see the first event (or "tipping point") in each stage of my funnel?
Funnel Events Technical Documentation
Funnel Static Event Configuration
What is a Starter Funnel?
Funnel Person Inclusion Configuration
Funnel Cohort Analysis Dashboard
Where are my customers stuck in journeys?
Funnel Cohort Analysis Use Cases
Funnel Data Explore Dashboard
Use Cases for Funnels
How do I know the last event that happened before a journey stage change?
How do I identify stage conversion rates?
Funnel Person Status Exits
Introducing CaliberMind's Funnels
Funnels - Lead, Contact, Account, Opportunity Statuses and Stages
Pressure Event Dashboard 101
Demand Generation Funnel Dashboard
Engagement and ABM
Engagement Scoring
Model Configuration
Customize Engagement Scoring Models - Start Here!
Engagement Scoring Models Overview
How to Change Event Touch Scores
How to Add or Change Engagement Score Multipliers
Add or Change Engagement Score Filters
Create Multiple Engagement Score Models
Which touches and events are we scoring?
Sales Opportunity Data Model
Engagement Scoring Time Decay - How It Works & How to Change It
Custom Attribution Configuration - Custom Weighting
Using Engagement Score to Trigger an Update in Salesforce
Default ABM Scoring Logic
Engagement Reporting
Engagement: Summary Tab
Engagement Overview: Companies Tab
Engagement Overview: People Tab
Engagement Overview: Campaigns Tab
Engagement Overview: Explore Tab
Company Engagement AI Summary
Account-Based Marketing Reports
Linking to CaliberMind Reports in Salesforce
ABM Best Practices
Account-to-Lead (A2L) Matching
Lead-to-Account Matching (L2A)
Pushing CaliberMind ABM Scoring Fields to Salesforce.com
3rd Party Intent Signals with Bombora
Tutorials and Use Cases
Digital Marketing Terminology
Customizing Report Visibility (Show/Hide)
How to Manage Your Offsite Events Using CaliberMind
How can I manage my BDR/SDR team activities with CaliberMind?
Combining Engagement Score with Attribution
Enabling the Sales Teams to see the Entire Buyers Journey
How Can I Identify High Risk Opportunities?
How does Sales leverage CaliberMind? Some key use cases.
Running a Sales/Pipeline Review with CaliberMind
How Is CaliberMind Different From My CRM Attribution?
CRM Campaign Member Status and Campaign Response Best Practices
How Do I Optimize Advertising Spend?
Campaign Best Practices Across Systems
How do I use CaliberMind to shorten our sales cycle?
Answering Business Questions Using CaliberMind Reports
Which of my leads are the most engaged?
How Do I Know If a Campaign Is Good or Bad?
How to Flatten Your Campaign Structure in Salesforce
Table of Contents
- All Categories
- System Overview
- CaliberMind Insights Dashboards
- Working in Insights
- CaliberMind Insights - Application Concepts and Terminology
CaliberMind Insights - Application Concepts and Terminology
Data Sources
Data models may be files or databases located on servers on a local network, or remote locations and web services. CaliberMind supports a variety of data sources, among which are:
- High-Performance databases such as Snowflake, Redshift, Big Query
- Traditional relational databases, such as SQL Server, MySQL, or Oracle
- Online web services, such as Salesforce.com, Google AdWords, Google Analytics, Zendesk, and more
- File-based data sources, such as spreadsheets (Excel) and CSV files
These sources are supported through native connectors, customer REST connectors, and JDBC drivers, which are used to import data into the ElastiCube Server.
Common Source Connection Types
- Live Data Sources - Live connections connect directly to the data source. Use a Live connection if your data changes frequently and your dashboard must reflect this.
- ElastiCube - Import your data into the ElastiCube to take advantage of CaliberMind's high-performance database.
Technology Partner Connectors
Technology partners enable connections to data sources via the data pipeline.
CaliberMind technology connectors include:
Adobe Analytics
Apple Search Ads
AppsFlyer
DoubleClick
Facebook Ads
Fresh Desk
Linkedin Ads
Magneto
Netsuite
Pardot
ElastiCube Data Hub
The ElastiCube Data Hub allows you to easily integrate data from multiple disparate data sources into a single source of truth, and enable viewing both near real-time and historical data from your sources.
The ElastiCube Data Hub provides the ability to deliver on your organization’s analytics strategy even when changes occur to underlying source systems. This includes not waiting for the completion of data warehousing projects to perform analysis. The data model can easily be adapted to changes in the underlying data architecture by easily reconnecting to changing sources systems ensuring continuity. Working with the ElastiCube Data Hub, you can fully utilize data from across your organization to ensure that you are seeing the full picture.
Data models are abstract entities that organize your data and determine how your tables relate to one another. CaliberMind has two types of models, Live models, and ElastiCube models. Which model you use depends on how you connect to your data source. If you want to run queries directly against the data source, you will use a Live model. If you are importing your data into CaliberMind, you will use an ElastiCube model.
Live and ElastiCubes models are created and managed from the Data page.
Live Model
Live models are a type of data model used to manage the schema over your Live data source. Live connections are useful for getting real-time updates, with changes in your data reflected in your dashboard.
ElastiCube Model
ElastiCubes are specifically designed to withstand the extensive querying typically required by business intelligence applications.
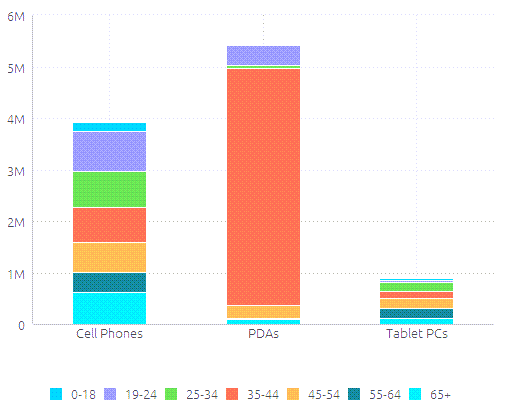
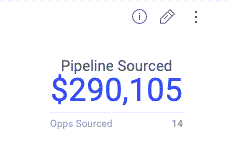
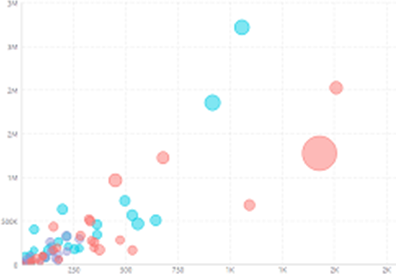
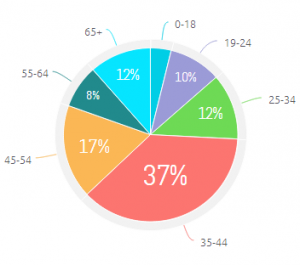
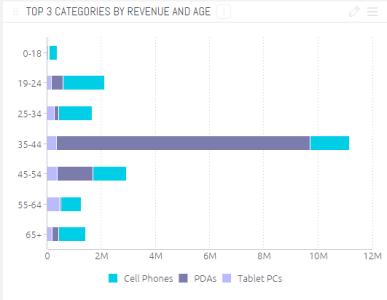
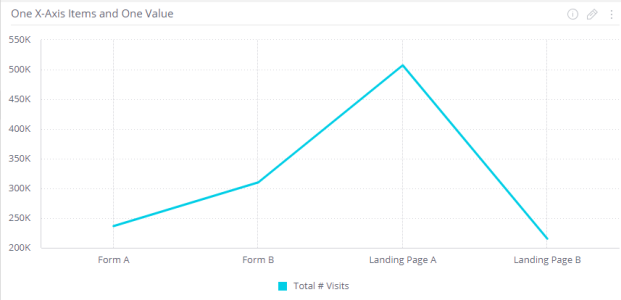
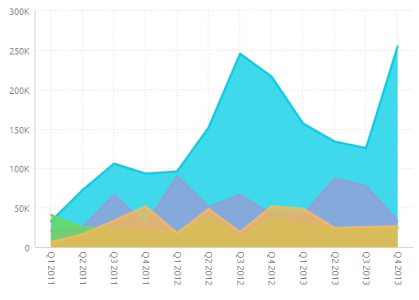
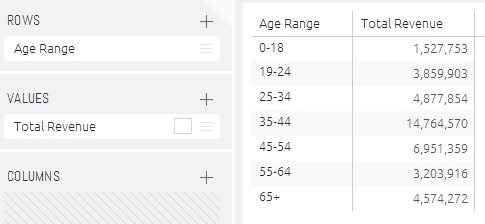
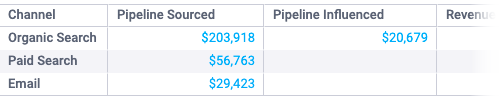
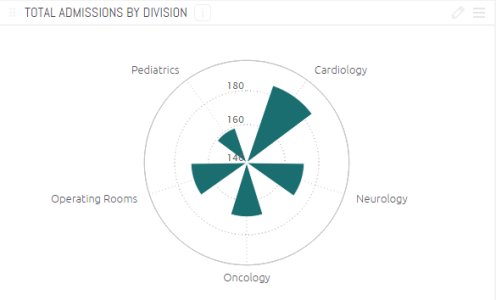
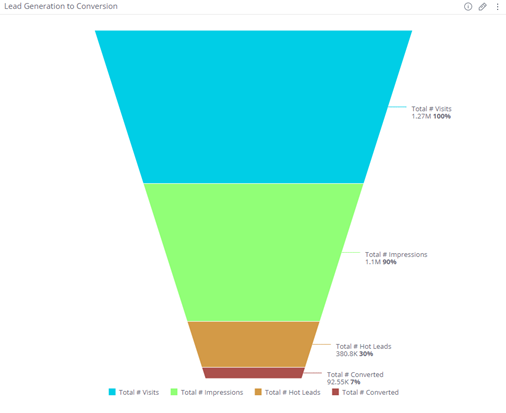
Widgets
Each widget is a dynamic visualization of data. You pick the type of data to appear in a widget and you pick the type of visualization (chart type). A few examples of widgets are displayed below.
 |
 |
 |
 |
|
|
|
|
|
 |
 |
 |
 |
|
|
|
|
|
 |
 |
 |
|
|
|
|
|
Other Widgets include: Accordion, Area Chart, Area map, Box and Whisker Plot, Calendar Heatmap, and Scatter Map. |
Dashboards
Dashboards are composed of various widgets which visualize the data you select and customize. It can be used for a variety of purposes, but its primary purpose is to provide easy access to information such as KPIs.
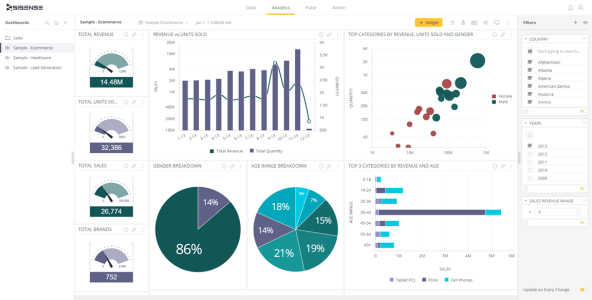
- Calibermind provides you a starting point with several templated dashboards such as Attribution, Engagement, Performance, Return on Ad Spend, and System.
- You define which widgets appear in the dashboard, their design, how they are organized, and the filtering of the data that appears.
- Calibermind allows you to create as many dashboards as you need. No limitations! When you create a dashboard, you are the dashboard’s owner. Owners can share dashboards that they have created with other Calibermind users.
- Calibermind provides a variety of built-in automatic dashboard sharing features. You can easily share a dashboard with others in the Calibermind environment or have a dashboard automatically delivered to your chosen recipients by email (on a scheduled basis or upon each data update).
Fields
Widgets are composed of fields that represent the data in your data sources. You create widgets by simply selecting from the fields displayed in a Data Browser, which appears in various places across the product. Each field represents a column of data in the Live Models. Each Widget is a Dashboard component and a dynamic visualization of data.
Each Field represents a column of data in the ElastiCube.
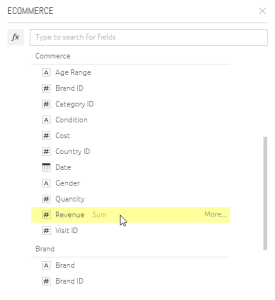
Numeric Fields: Numbers (quantified data), such as salaries, sales, scores, number of clicks. This is data that you may want to aggregate or calculate. For example, the sum of sales or the average of costs.
Date Fields: Dates can describe both date and time values. Dates can be used to organize your data into hierarchies according to year, quarter, and month or into buckets of time such as by the hour or by 15-minute intervals.
Descriptive Fields: Items used to label and categorize, such as Products, Locations, and other categories.
Filters
The Filters panel on the right of the dashboard provides data filtering options that affect the data displayed in the widgets. You can change these filters to focus on more specific data. Filters are used dynamically to interact with dashboards
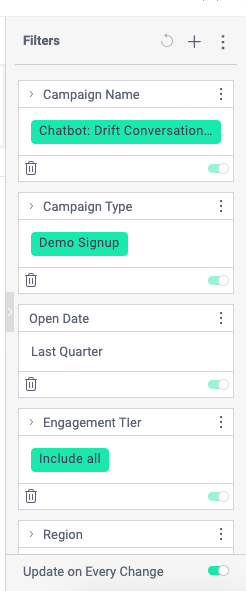
For more on Filters, visit our Filter documentation.
Aggregation Types
Aggregation Types can be used in dashboards when you want to toggle between views.
For example, our out-of-the-box Attribution Summary Dashboard allows you to select whether you want to view the underlying data by opportunity closed date or opportunity open date. These views have their own use cases, which you can find more information on here.
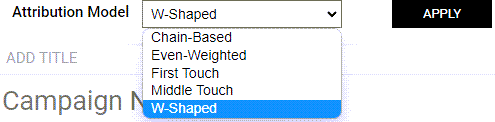
Attribution Models
The attribution model outlines how sales and conversions should be credited along the conversion path.
Chain-Based
If you have a sizable data set (200-400 Closed Won opportunities) or have worked with your customer success representative to train your model against meetings or pipeline generated, we recommend using the Chain-Based model. This machine learning model looks for the most common pattern or sequence of events and weights activities accordingly. This model removes human bias and reflects the most common winning scenario.
Even-Weighted
Finally, the Even Weighted model is good for organizations that don't want to dictate which touches get extra weight applied based on sequence or person. This model naturally gives more weight to the touches that more people gravitate to rather than applying any assumptions.
First touch: The First-touch attribution model attributes 100% of the credit to the first marketing touchpoint (the channel or activity through which the contact was acquired).
If you want an estimate of which campaigns are initially engaging prospects that convert into revenue or pipeline, we recommend using the First Touch model. This looks at all contacts and leads associated with an account and chooses the touch that happened up to 365 days prior to opportunity creation.
Middle Touch
If you want an estimate of which campaigns are encouraging people to engage with sales or signal an opportunity should be created, we recommend using the Middle Touch model. This looks at all contacts and leads associated with an account and chooses the touch that happened immediately prior to opportunity creation.
W-Shaped
If you don't have a lot of Closed Won opportunities and have confidence in your sales team's ability to consistently identify the primary contact on the opportunity, a W-Shaped model may be the right fit. This model takes into account all touches associated with the opportunity but applies additional weight to the first touch, middle touch, and any touches associated with the primary contact. If your sales team does not use contact roles, this model turns into what is known as a U-Shaped model and weights the first and middle touch more heavily, which can still be useful.
We have additional articles that give you more information on Engagement Terminology and Key Concepts, using Dashboard Templates, with details on drilling down and filtering data.