As the new CMO, I've been charged with guiding my team to develop better strategies using the same budget. This process will be guided by mapping my customer journey to determine which touches (and personas) propel each stage to the next in our funnel.
Initially, this project will deconstruct our funnel from a Start Stage of "inbound" (or accocunts with inbound engagements like website traffic but not yet qualified) to an End Stage of "closed-won."
We recommend revisiting your original analysis and digging into more granular details for the best results, and this use case is meant as a generic starting point.
CaliberMind Funnel Concepts: Pressures & Triggers
Triggers and Pressures
Unlike most funnel products, CaliberMind views funnel journeys as a complete collection of brand interactions with a customer or prospect with benchmarks for when the account first reaches each stage. This means we include every touchpoint between the journey start and end instead of focusing on a single touchpoint recorded at the point of qualification.
As a result, we can track every interaction with the brand as each person or account moves through the funnel. These brand interactions or "events" may include clicking on a paid media ad, exploring a website, scheduling a demo, or talking to a salesperson.
Our funnel framework divides these brand interactions into two types:
Terminology
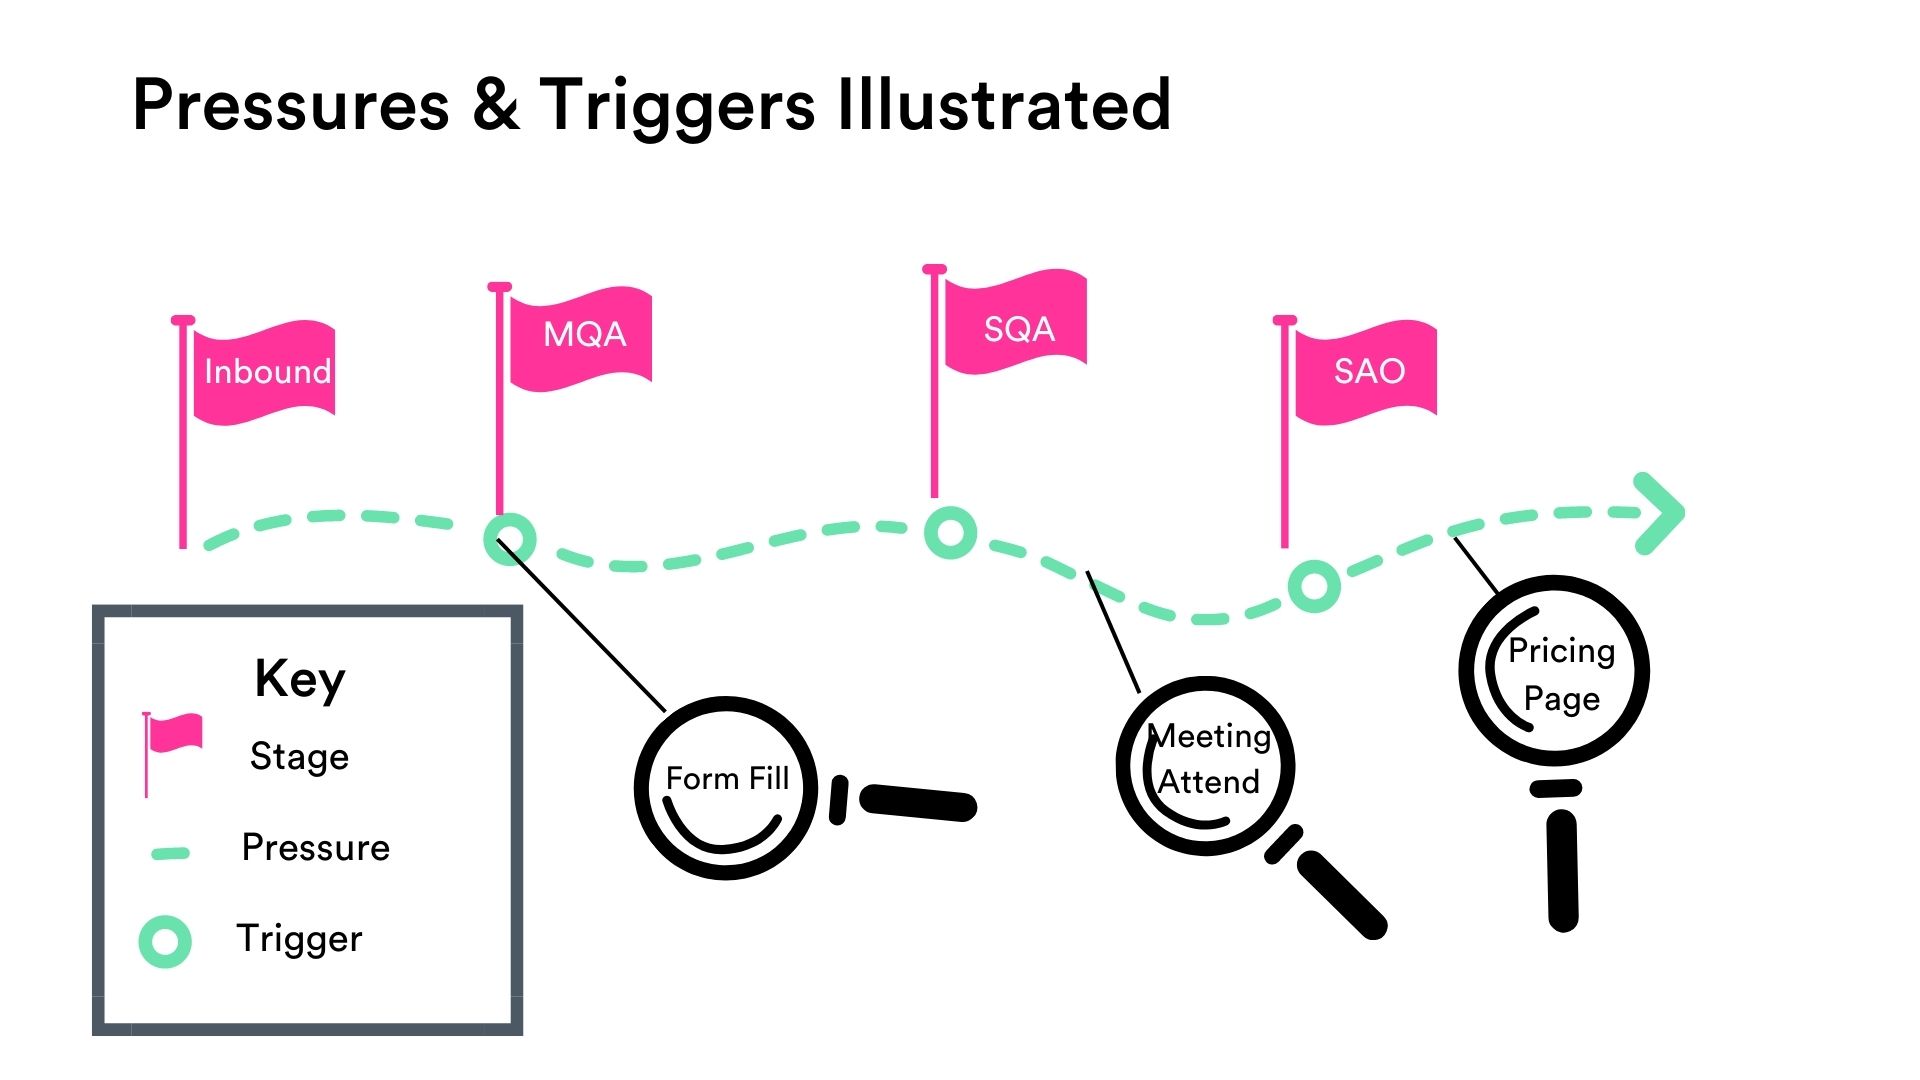
Trigger Events
During the journey, Trigger Events are the touchpoints that happen immediately before recording a new stage being reached. A few examples are: 1) A journey becomes a Marketing Qualified Lead when someone fills out a form on your website. The form fill is the Trigger Event. 2) A journey becomes a Sales Accepted Opportunity when an opportunity record is created in Salesforce and has an amount associated with it. The opportunity creation is the Trigger Event. 3) A journey becomes a Customer when marked as Closed-Won in Salesforce. The opportunity stage being updated to "Closed Won" is the Trigger Event.
Pressure Events
Most of the interactions in a funnel journey are pressure events. These events represent the interactions an account or person has with your brand that are not trigger events. For example: 1) A lead interacting with specific content on your website after becoming a Marketing Qualified Lead. The website visit is a Pressure Event. 2) A prospective customer responding to an outbound email after becoming a Sales Accepted Opportunity. The email response is a Pressure Event. 3) A prospective customer bringing their CMO to a demo after becoming a Late Stage Opportunity. The meeting is a Pressure Event.
In simple terms, triggers benchmark the stages of a funnel, and pressure events speak to all the touchpoints between stages and how influential they are. When we want to understand, “What are the most influential touchpoints in our buyer journey?” we typically care as much about what pressure events tell us. For example, if we want to understand how effective our content strategy is or which key web pages a person visits at later stages, Pressure Events are where you want to look!
While triggers highlight necessary behavior, their operational nature often represents a company's internal process (a field value changing like an opportunity's stage update) rather than the prospect or customer's meaningful interactions with your brand.
Pressure Event Features
When we want to understand exactly which brand interactions makes someone more likely to buy, we can use the many features linked to that event to figure out what about those interactions are most influential to success. Examples would include the company's industry, a person's job title, and the campaign type. Having access to these features helps us understand whether it was the type of content the person was interacting with that was more influential or if it was more important that the person consuming the content was in the C-Suite, for example.
Having these features also allows us to understand more about the profile of companies and personas that interact with our brand at which stage of the funnel.
Within CaliberMind, we focus on the following features of inbound signals for pressure events:
Campaign: Campaigns in CaliberMind represent both the traditional CRM and Marketing Automation System (MAS) campaigns and "virtual campaigns." Virtual campaigns are events that would not make sense as a campaign member but do make sense for funnel tracking and attribution. For example, sales tasks and events, deal registrations, and digital platform campaigns associated with clicks and form fills.
Campaign Type: Campaign types are used to bucket channels, tactics, or program types. This is a standard concept in CRMs.
Channel: In CaliberMind, we think of Channels as the UTM Source associated with the click that led to the campaign member being created in your CRM or MAS.
JobTitle: Understanding a person's title in your funnel can help refine targeting strategies and ideal customer profiles.
Job Level: Titles can vary greatly depending on who or what is populating the field in your CRM, so standardized job levels, such as Functional, Manager, Director, VP, etc., allow for summary analysis or bucketing title types across target companies.
Department: Again, titles can vary greatly depending on who or what is populating the field in your CRM. Standardized departments, such as Marketing, IT, HR, Sales, etc., allow for summary analysis or bucketing title-related departments across target companies.
Industry: Funnel journeys can vary wildly based on the industry of a target customer. Pivoting by this value allows customers to confirm their ideal customer profile and understand which content appeals to certain audiences.
Journeys: Journeys still active in the considered stages are not included in the odds or ratio calculations. We only analyze journeys that have successfully progressed beyond the "success" criteria in your filter selection or exited early as a "failure."
Measuring Success vs. Failure
Within the Pressure Event dashboard, we focus on the following definition of impact:
Whether a particular subset of characteristics associated with common events happens more often on successful events than failures.
Successes: Successes are the journeys that have moved from your selected Start Stage to the End Stage within the selected period. Ex:
All journeys that made it from Lead to Customer last year.
All journeys that made it from Lead to MQL last quarter.
All journeys that made it from MQL to SAO in the last 18 months.
A Start Stage is the broader population or accounts/people in your starting group.
An End Stage is where you ideally want to influence the Start Stage population to go. Accounts/people that began in the start stage and reached the end stage in your defined period are considered the "success" population.
Failures: Failures are the journeys that start in Stage A and exit early. The reasons why they may exit include:
Exceeding the time limit configured for a relevant stage in your funnel.
Taking some kind of action that results in an exit, like marketing a qualified lead "Nurture."
By looking at successes and failures and comparing how activities balance between the groups, we can understand the relative impact any feature has on successfully navigating the journey.
An example best illustrates this concept.
Example
Bruce is interested in the impact of a specific marketing campaign on leads converting to customers last year. During his analysis, he gathers the following metrics:
Of the 100 customers acquired last year, 20 interacted with his campaign at some point during their journey, while 80 didn't.
Of the 1000 journeys that failed to become customers, 100 interacted with his campaign, while the remaining 900 did not.
Based on this data, Bruce calculates the odds of success for the group that saw his campaign as 20/100 or 20%. Similarly, he calculates the odds of success for the group that did not see his campaign as 80/900 or about 8.8%. Comparing these two groups, he calculates the relative impact of seeing his campaign approximately 20/8.8 or about 2.27. This means that when these two groups, those that interacted with Bruce’s campaign are 2.27 times more likely to become customers than those that didn’t.
We list the # of Success with Feature for a reason! The law of small numbers means that the smaller the population set we are analyzing, the more we should take the result with a big grain of salt.
Pressure Event Dashboard Basics
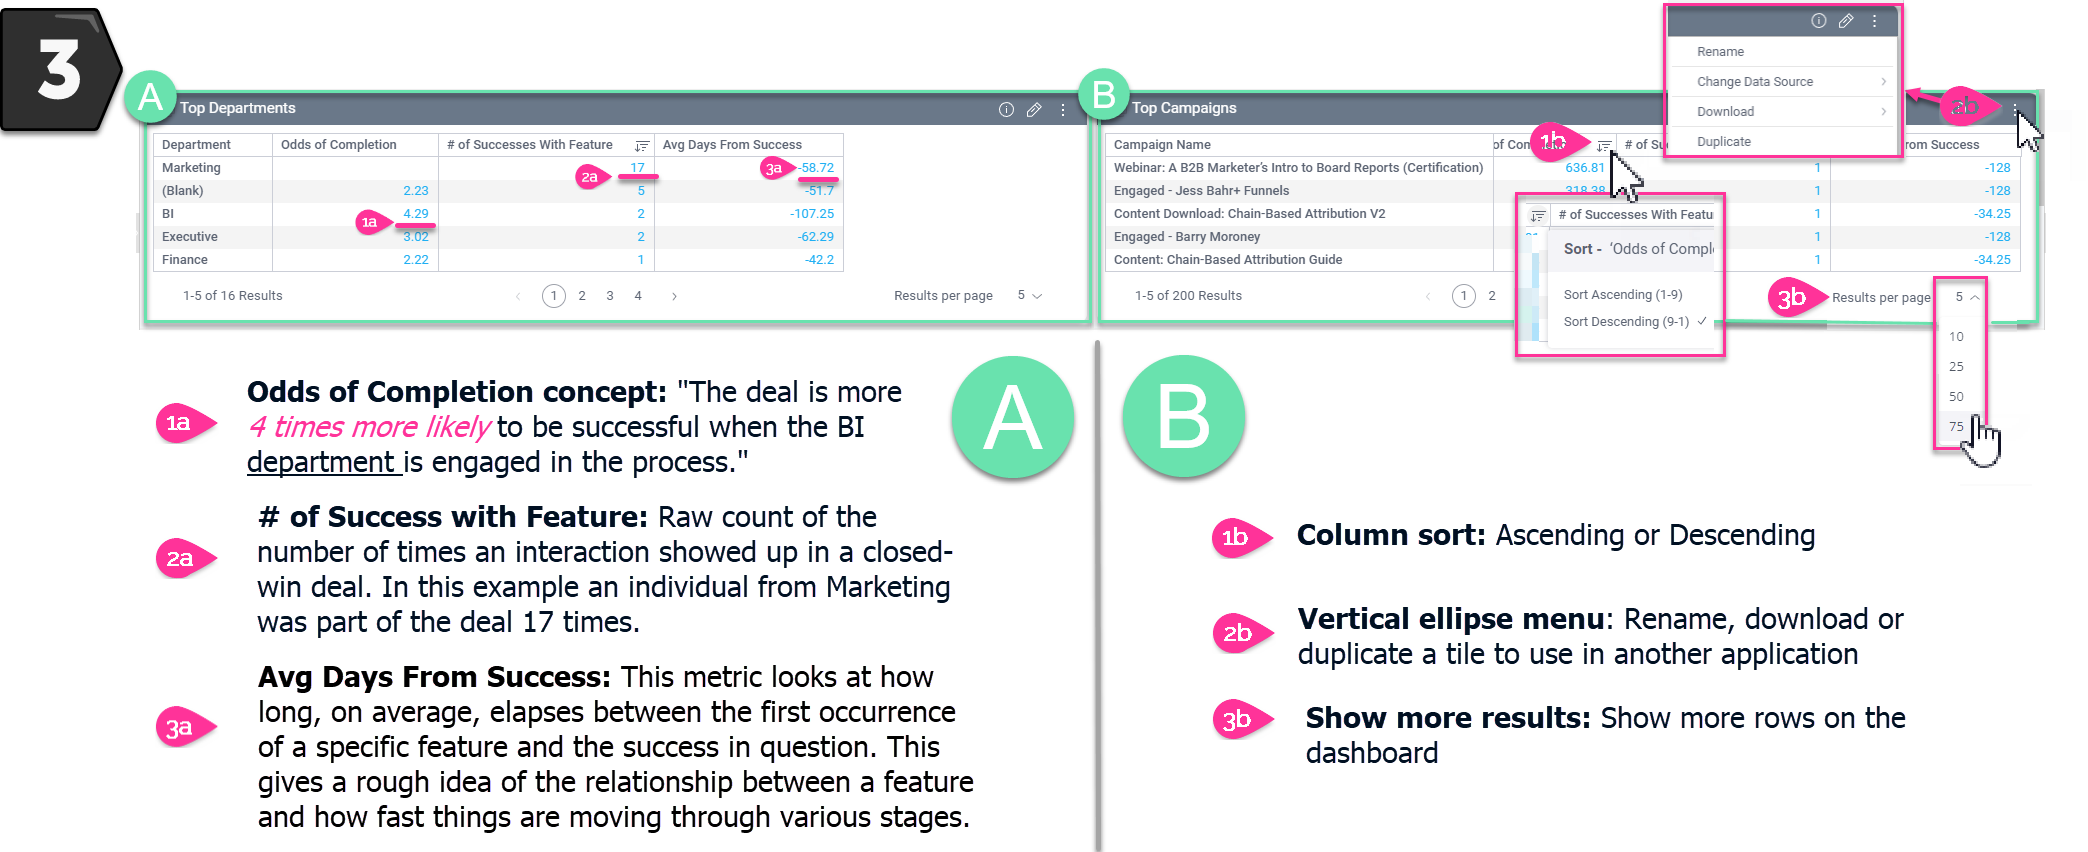
Odds of Success: This is the relative odds measure described in our example illustrated in the previous section. Values here represent the impact multiplier a given feature has on success. Examples of statements we may take away from these charts include:
Healthcare Services companies are 2.5 x more likely to become customers than other companies.
Leads that downloaded an E-Book are 4.5 x more likely to become Sales Accepted Opportunities.
Journeys that have a CXO level title involved are 10.5 x more likely to become customers than those that don’t.
# of Successes with Feature: This is a raw count of the number of times a particular feature showed up in successes. Low occurrence rates can inflate relative measures, so this value shows an additional dimension of prevalence. Examples include:
47 Sales Qualified Leads interacted with Paid Search.
15 Marketing Qualified Leads downloaded a podcast.
3 Customers were from the Consumer Packaged Goods industry.
The lower the value, the less we should rely on the Odds of Success being consistently impactful.
Avg Days From Success: This metric looks at how many days, on average, pass between the activity with the selected feature and the End Stage or "success." This gives a rough idea of the relationship between a feature and how fast things are moving through various stages. Examples include:
An average time of 47 days between the first time a lead downloads an E-book and becomes a Sales Accepted Opportunity.
An average time of 30 days elapses between the first time someone from Legal shows up on a journey and that journey becomes a customer.
An average of 14 days between the first time someone visits your website and becoming a Marketing Qualified Lead.
Pressure Dashboard Overview
The Pressure Events Dashboard is a series of tiles that tell a story through visualizations. Pivot tables are used to present the story's highlights. Each pivot table contains blue interactive hyperlinked values that allow readers to drill down into the data for granular details. This dashboard can be modified, customized, duplicated, and shared - like any CaliberMind dashboard.
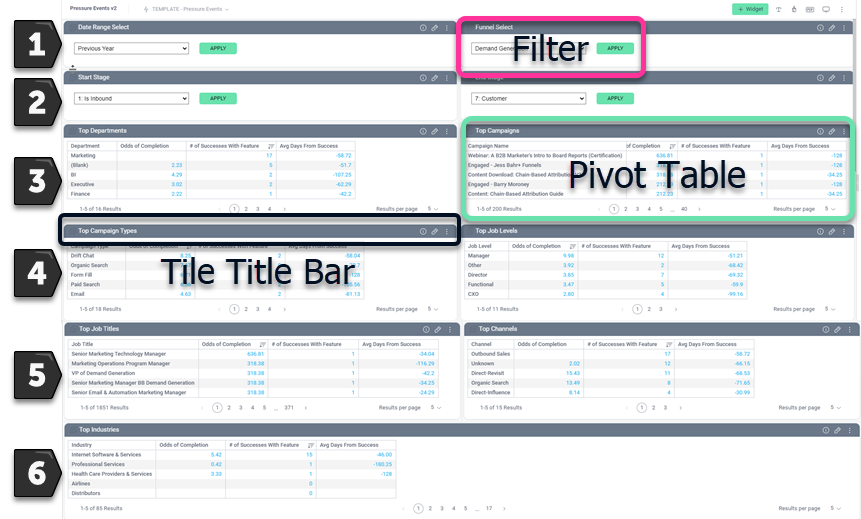
Below we will break out each of the six (6) dashboard sections. Each section of the Pressure Events Dashboard is either a filter or a pivot table. For each section, we describe the general behavior, purpose, definition, and details below.
USING THE PRESSURE EVENTS DASHBOARD
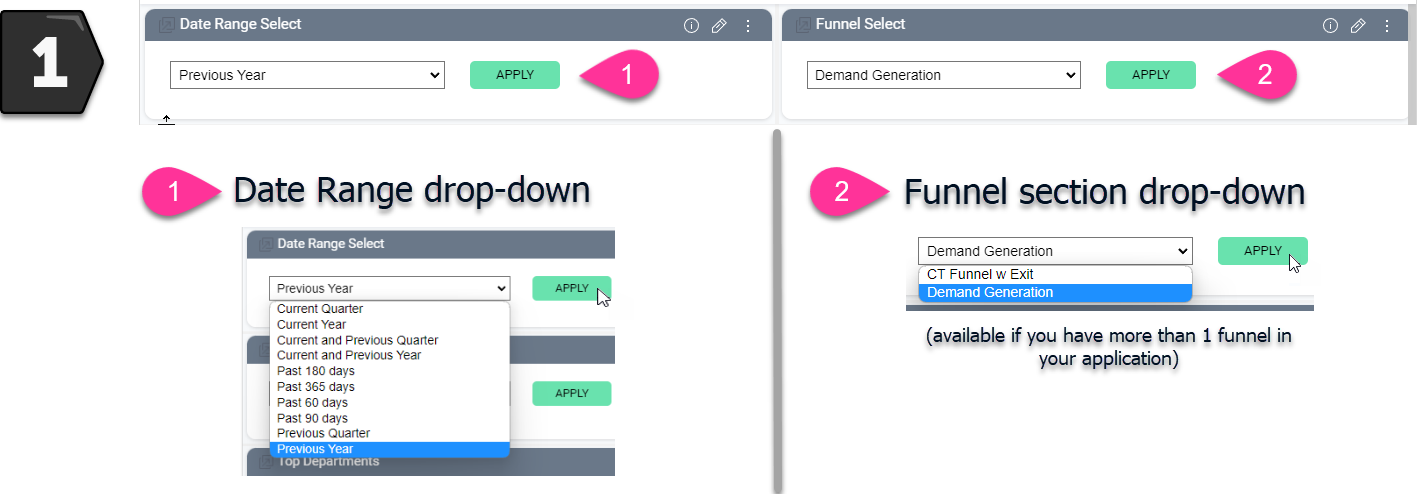
Section 1
Note: The date ranges are pre-populated and fixed based on the system's current algorithms. We are working on future flexibility upgrades to this feature.
Select the date range for the Start Stage you want to analyze and then click APPLY.
Select the desired funnel, if applicable, and click the green APPLY button.
It's important to know how long it usually takes for a journey to move from your start stage to the end stage. For example, if it usually takes six months for a customer to move from MQL to Customer, only analyzing the last quarter's worth of data doesn't make sense. Either select a less ambitious jump in end stages (perhaps we analyze MQL to qualified opportunity instead) or change your date range to reflect a population of Start Stage accounts that have "timed out."
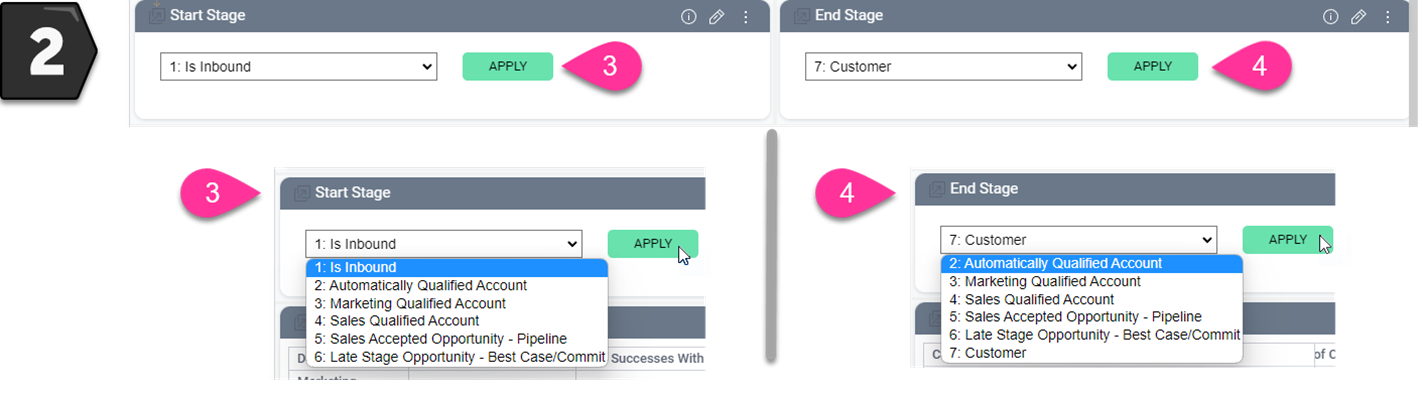
Section 2
Select the Start Stage or the beginning population you want to evaluate and click APPLY.
Select the End Stage or the definition of a "successful" subset of the Start Stage to analyze, and select the green APPLY button.
The Start Stage MUST be a stage that happens BEFORE the End Stage.
Section 3
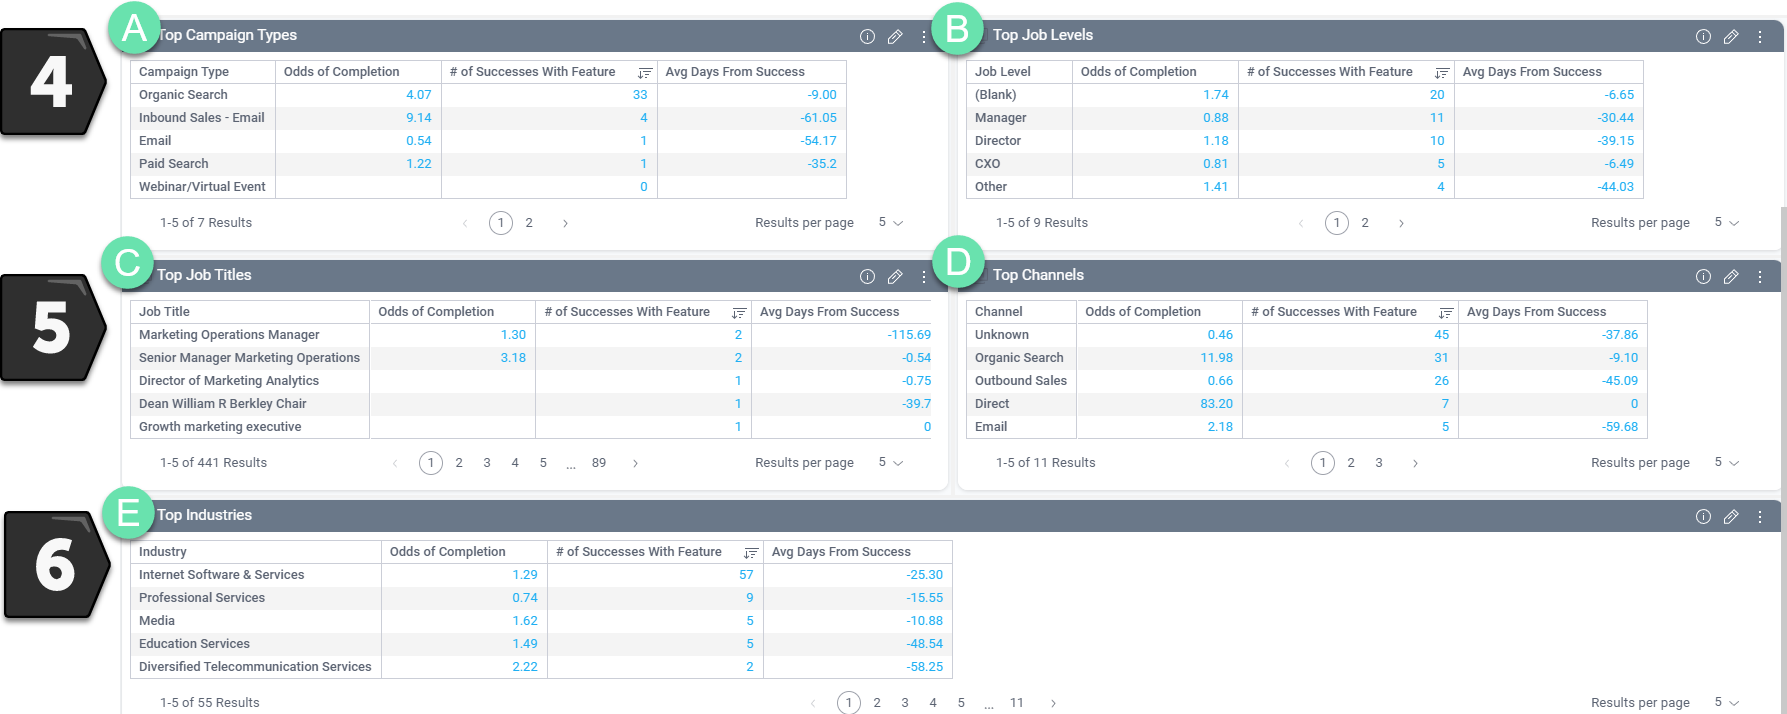
Section 4, 5, and 6
The following portion of the Pressure Events Dashboard considers the characteristics of a prospect or customer company that are important to your Ideal Customer Profile (ICP.) Filtering results from previous campaigns based on ICP characteristics can help you better understand how your identified target audience has impacted the success or failure of past campaigns. This provides insights into a future campaign's probable success or failure if it targets similar company features and characteristics.
By understanding the different characteristics and results of recently run campaigns, you can gain insight into future strategic needs and challenges. This knowledge can help you craft your messaging and offer relevant solutions. Additionally, these characteristics can help you continually narrow your Ideal Customer Profile and target the companies most likely interested in your product or service.
Top Campaign Types: When you know your top campaign types you'll be able to acurately alocate budget, align strategy, and quickly hit your marketing goals
Top Job Levels:Knowing what job level the decision makers and influencers of a company have is beneficial because then you can craft your message in a way that resonates with their role and responsibility. Additionally, you can use that information to determine which companies are likely to have decision makers and influencers with the appropriate job level to be interested in your product or service.
Top Job Titles: The job titles of the people engaged with the buying process allow you to focus your efforts on those with the greatest potential to move your deal forward. Additionally, it can assist you in tailoring your message to your intended audience. Identifying decision makers and influencers can also be done using job titles.
Top Channels: Analyze the channels where you have seen the most success and focus your efforts there. Once you have identified the channels that have provided the best results, you can fine-tune your targeting and messaging to maximize the effectiveness of your campaigns.
Top Industries:It is necessary to know which industries will be the most likely to purchase from you so that your messaging can be tailored to their needs and interests. It can also help you identify potential partners and influencers in those industries that can help you reach a larger audience.