Table of Contents
- Using CaliberMind to Improve Stage Conversion Rates
- Video: How to Use CaliberMInd to Identify Sticking Points in My Funnel
- Instructions: How to Use CaliberMind to Identify Sticking Points In My Funnel
- Video: How to use CaliberMind to see which salespeople are the best at managing different stages.
- How can I use CaliberMind to flag engaged accounts to sales and shorten my sales cycle?
- Video: Using Engagement Emails to Alert Sales
- How to use CaliberMind Attribution data to shorten the sales cycle
- Video: How to use CaliberMind to create more pipeline
- How to use CaliberMind Attribution reports to generate more pipeline
- Video: How to use CaliberMind to create more bookings
- How to use CaliberMind Attribution reports to generate more bookings
- Other CaliberMind Tools to shorten sales cycles
How do I use CaliberMind to shorten our sales cycle?
- Using CaliberMind to Improve Stage Conversion Rates
- Video: How to Use CaliberMInd to Identify Sticking Points in My Funnel
- Instructions: How to Use CaliberMind to Identify Sticking Points In My Funnel
- Video: How to use CaliberMind to see which salespeople are the best at managing different stages.
- How can I use CaliberMind to flag engaged accounts to sales and shorten my sales cycle?
- Video: Using Engagement Emails to Alert Sales
- How to use CaliberMind Attribution data to shorten the sales cycle
- Video: How to use CaliberMind to create more pipeline
- How to use CaliberMind Attribution reports to generate more pipeline
- Video: How to use CaliberMind to create more bookings
- How to use CaliberMind Attribution reports to generate more bookings
- Other CaliberMind Tools to shorten sales cycles
Every business has a goal to grow revenue as quickly as possible. With advanced analytics, we can create more effective marketing strategies, elevate potential CRM or marketing automation system issues, and raise sticking points for the sales team. We’ll cover the most literal ways to identify where and how to speed up sales stages using Funnels, suggest how to get the sales team involved in the selling cycle earlier using Surge Scoring alerts, and look at how we can optimize for pipeline and bookings using attribution rather than name collection or lead volume.
At the bottom of this article, we’ll suggest less direct ways to make a big impact on your company’s bottom line.
Using CaliberMind to Improve Stage Conversion Rates
Revenue Operations professionals have a lot of experience implementing and using funnels to squeeze more pipeline and revenue out of their go-to-market teams. They use a simple concept to do so. They believe that the three main levers that they can influence in the sales cycle are:
- Volume
- Conversion Rates
- Velocity (time in stage)
If any of these factors move in the right direction, you will generate more pipeline and bookings. Leadership focused on using data to improve their team’s performance also understand that gains are easier (and more affordable) to achieve if we focus on finding inefficiencies in our go-to-market motion and fixing them. This could mean fine-tuning systems, tweaking the marketing tactics we’re investing in, or improving sales training – most often it’s a combination of many things!
For example, the conversion rate between marketing qualified lead and sales accepted opportunity can be impacted by:
- A misalignment between marketing and sales on the definition of “qualified”
- A marketing mix that emphasizes top of funnel activity over mid-funnel conversions
- System setup issues (a broken integration, poor list view maintenance, and inadequate gating of low-value leads are just a few possibilities)
- Lack of sales rigor around follow up
- Misalignment between sales and marketing messaging
- And More!
CaliberMind can help you identify where there is a problem or sticking point, and then your team will need to do research to figure out what exactly needs to be changed. We recommend starting with your Funnel Trend Analysis dashboard to research conversion rates and have given a couple of options to start (remember, it’s only a starting point!) researching next.
Video: How to Use CaliberMInd to Identify Sticking Points in My Funnel
Instructions: How to Use CaliberMind to Identify Sticking Points In My Funnel
Tip: We recommend analyzing at least two years worth of data and looking for seasonal trends to explain slow points in the year.
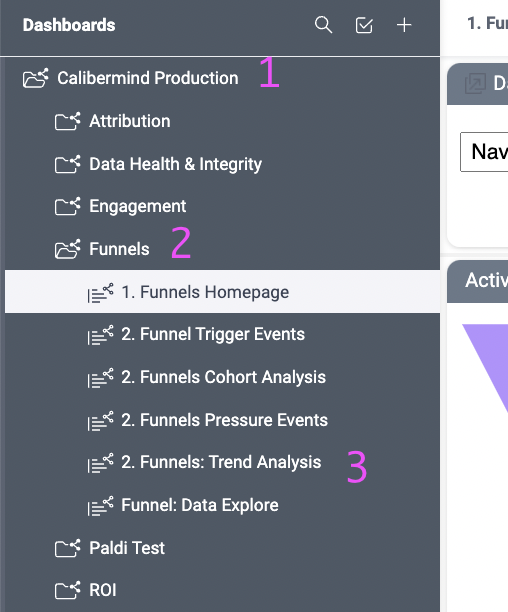
- Navigate to CaliberMind Insights, expand your dashboard template folder (1), and expand the Funnel folder (2). Then open the Trend Analysis dashboard (3).
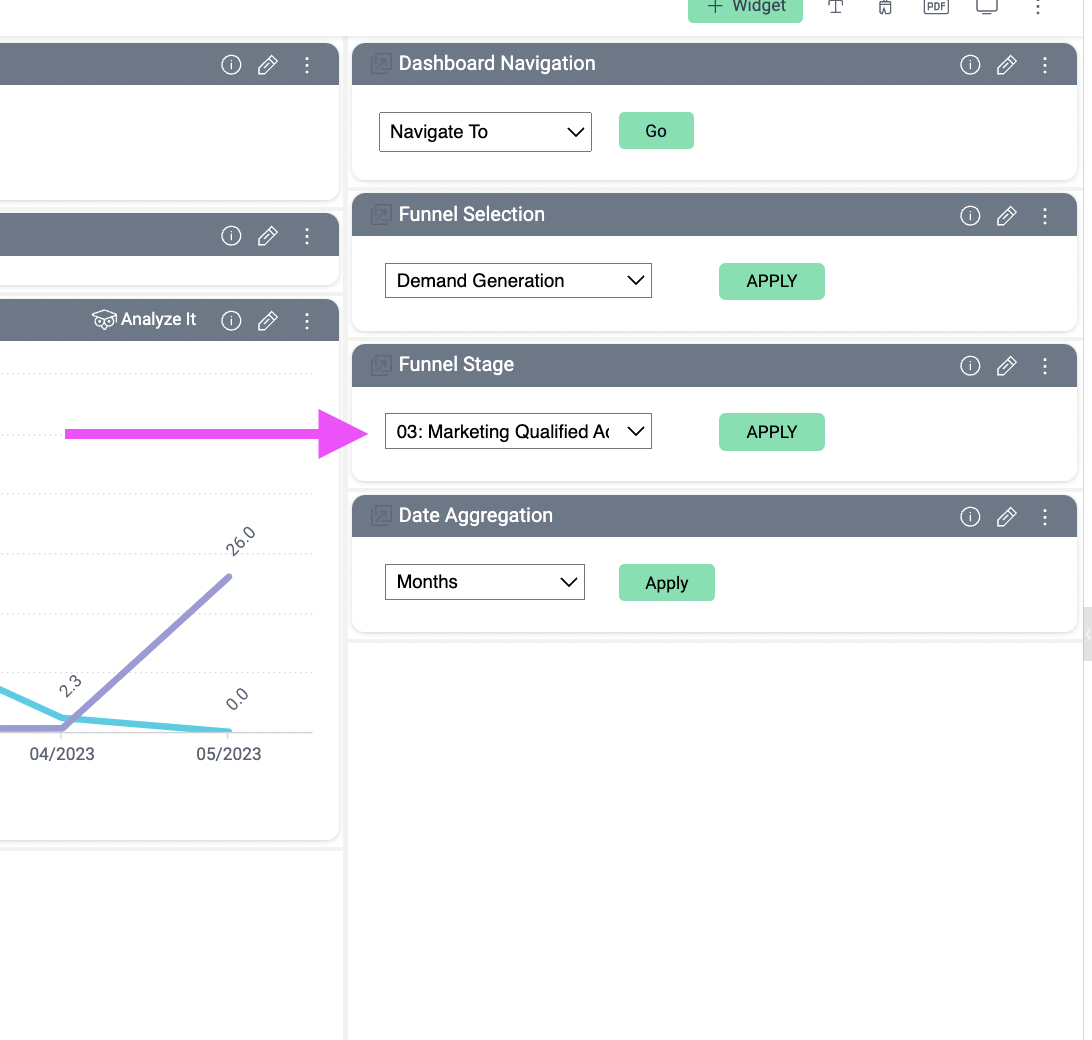
- Select the equivalent of your marketing qualified stage or when a record becomes a lead sales should follow up on, then click the green Apply button:
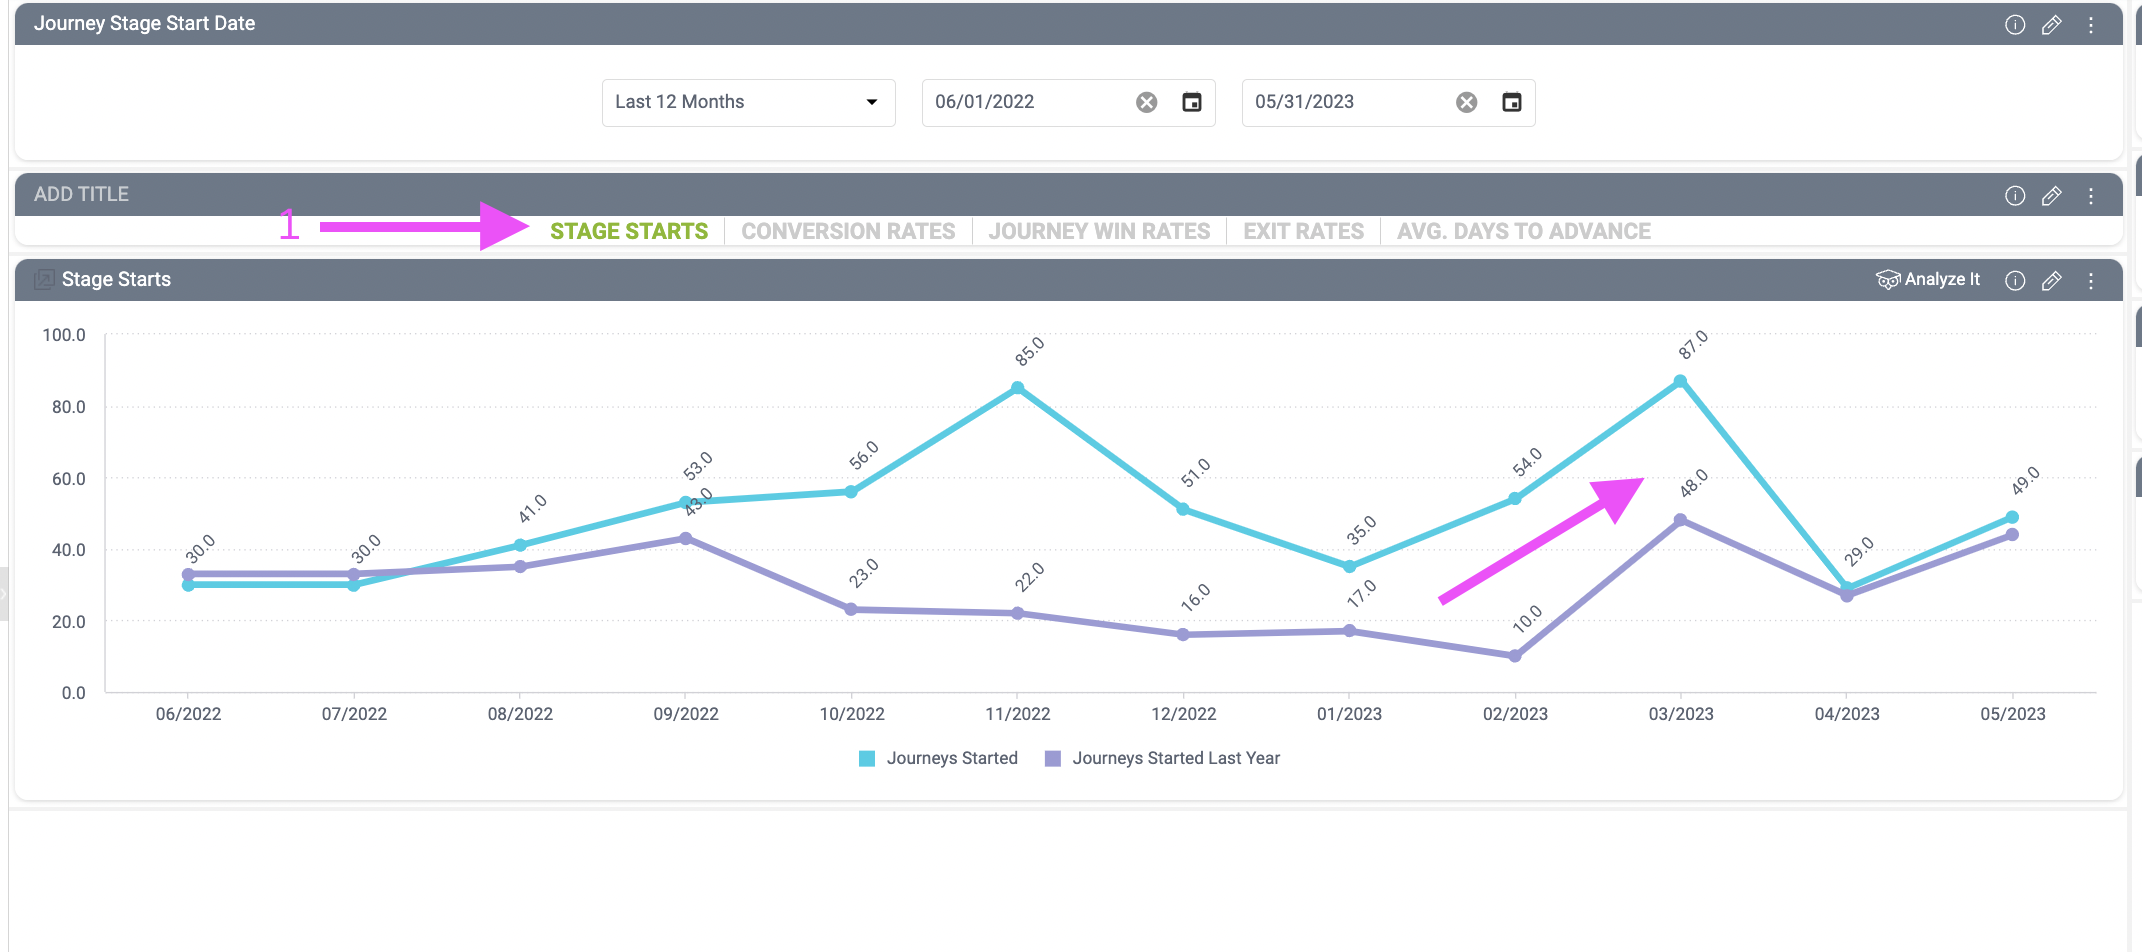
- First, analyze the volume by selecting Stage Starts (1) to see if you’re trending in the right direction. If in the data is moving in the wrong direction, or is less than the prior year's volume, this may be a point of research for your marketing team.
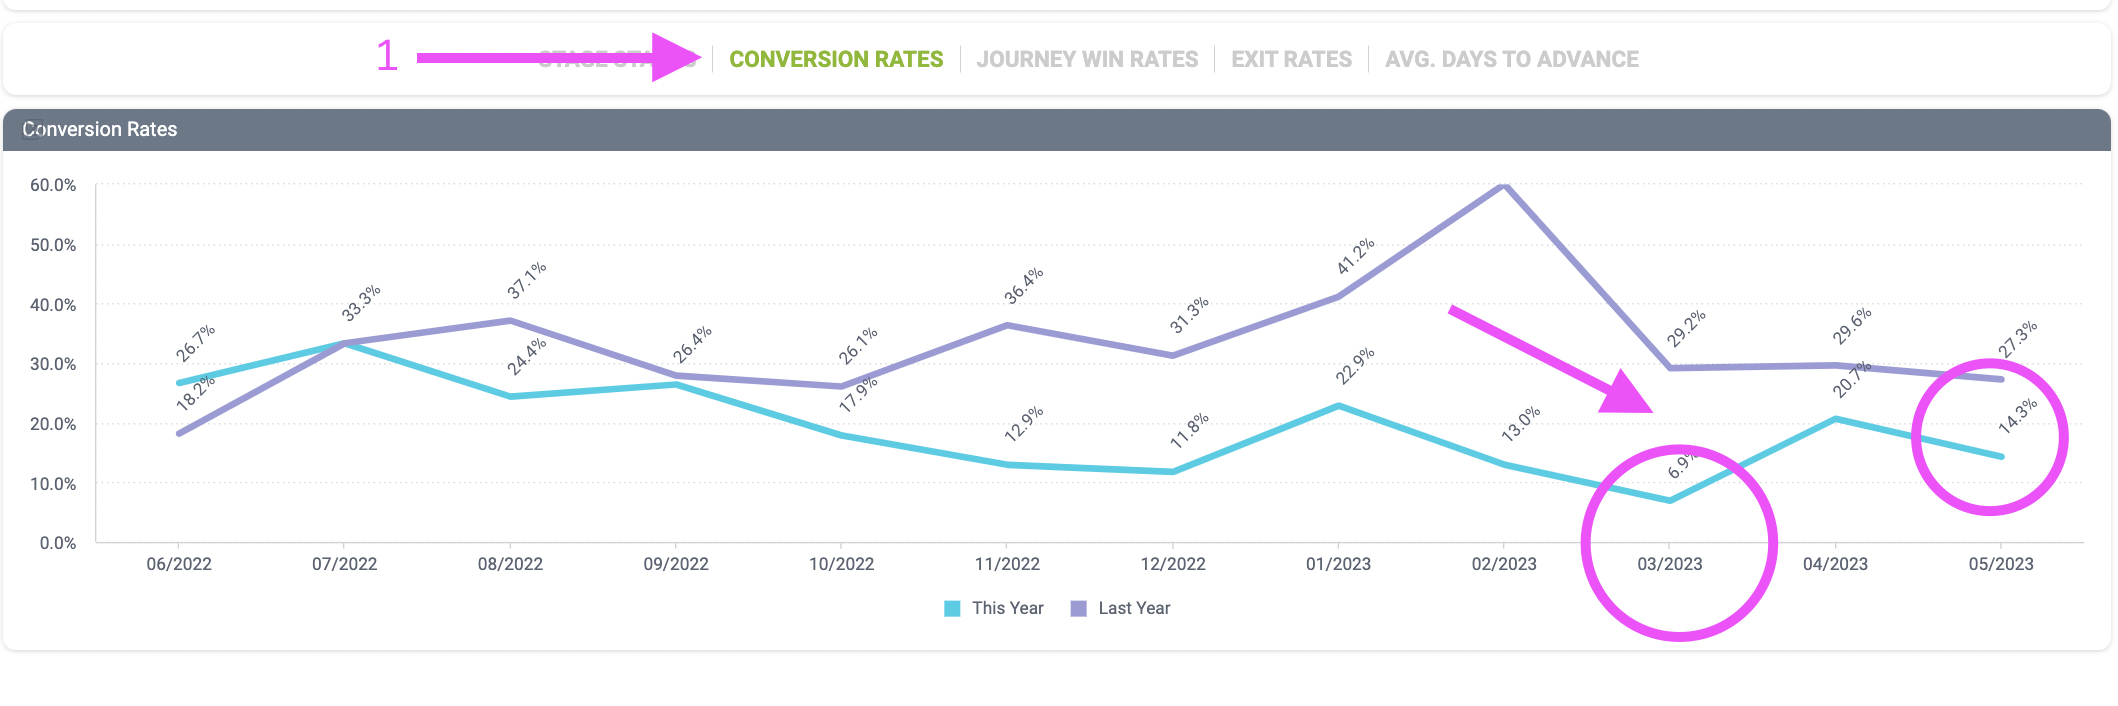
- Analyze your conversion rate over time by selecting Conversion Rates (1), keeping in mind your volume stats. If your lead volume is high but conversion rates are low, this is a signal you should research your marketing mix and whether you need to start or change how you gate leads. If your volume is low and the conversion rate is high, you’ll need to research which lead sources turn into qualified leads and see if you can increase the volume of these high-value leads.
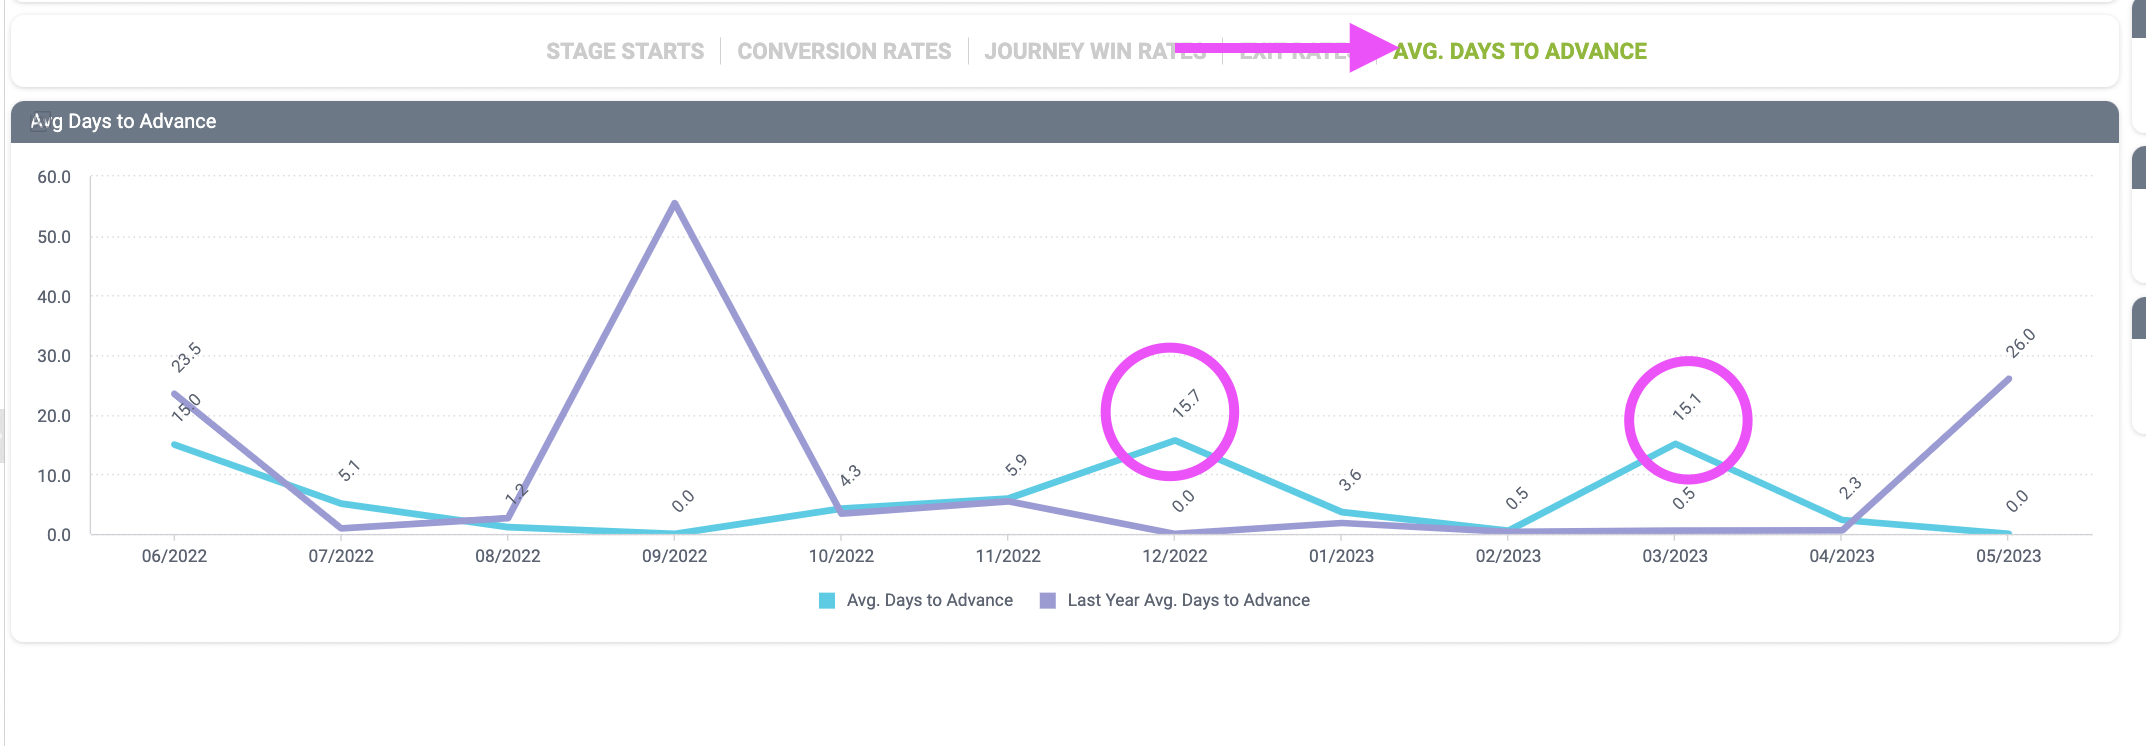
- Next, look at the time the leads are in the stage by selecting Avg. Days to Advance (1). If things are sitting for a long time, we may have a visibility issue, or we may have a sales management issue.
Based on the data we have reviewed, there are a few possible next steps to identify exactly what we should change to make things move faster:
- Determine whether marketing’s definition of ICP and qualified matches sales' definitions
- Research which lead sources convert the best
- Research how your lead mix is currently configured and consider emphasizing the higher-converting sources more
- Research the system to see if the salespeople know how to find their leads
- Have a conversation with the sales manager to see what SLAs are in place or if any urgency needs to be created
In this example, we’re going to look at what triggers the qualified lead and then which lead sources most often turn into an opportunity.
First, I’ll look at conversion rates by trigger activity across all time by navigating to the Data Explore dashboard, setting the Date Aggregation to Stage Start (1), Row Selection (2) to Campaign Type, the Column Selection (3) to Stage Name, and the Metric Selection (4) to Conversion Rate:
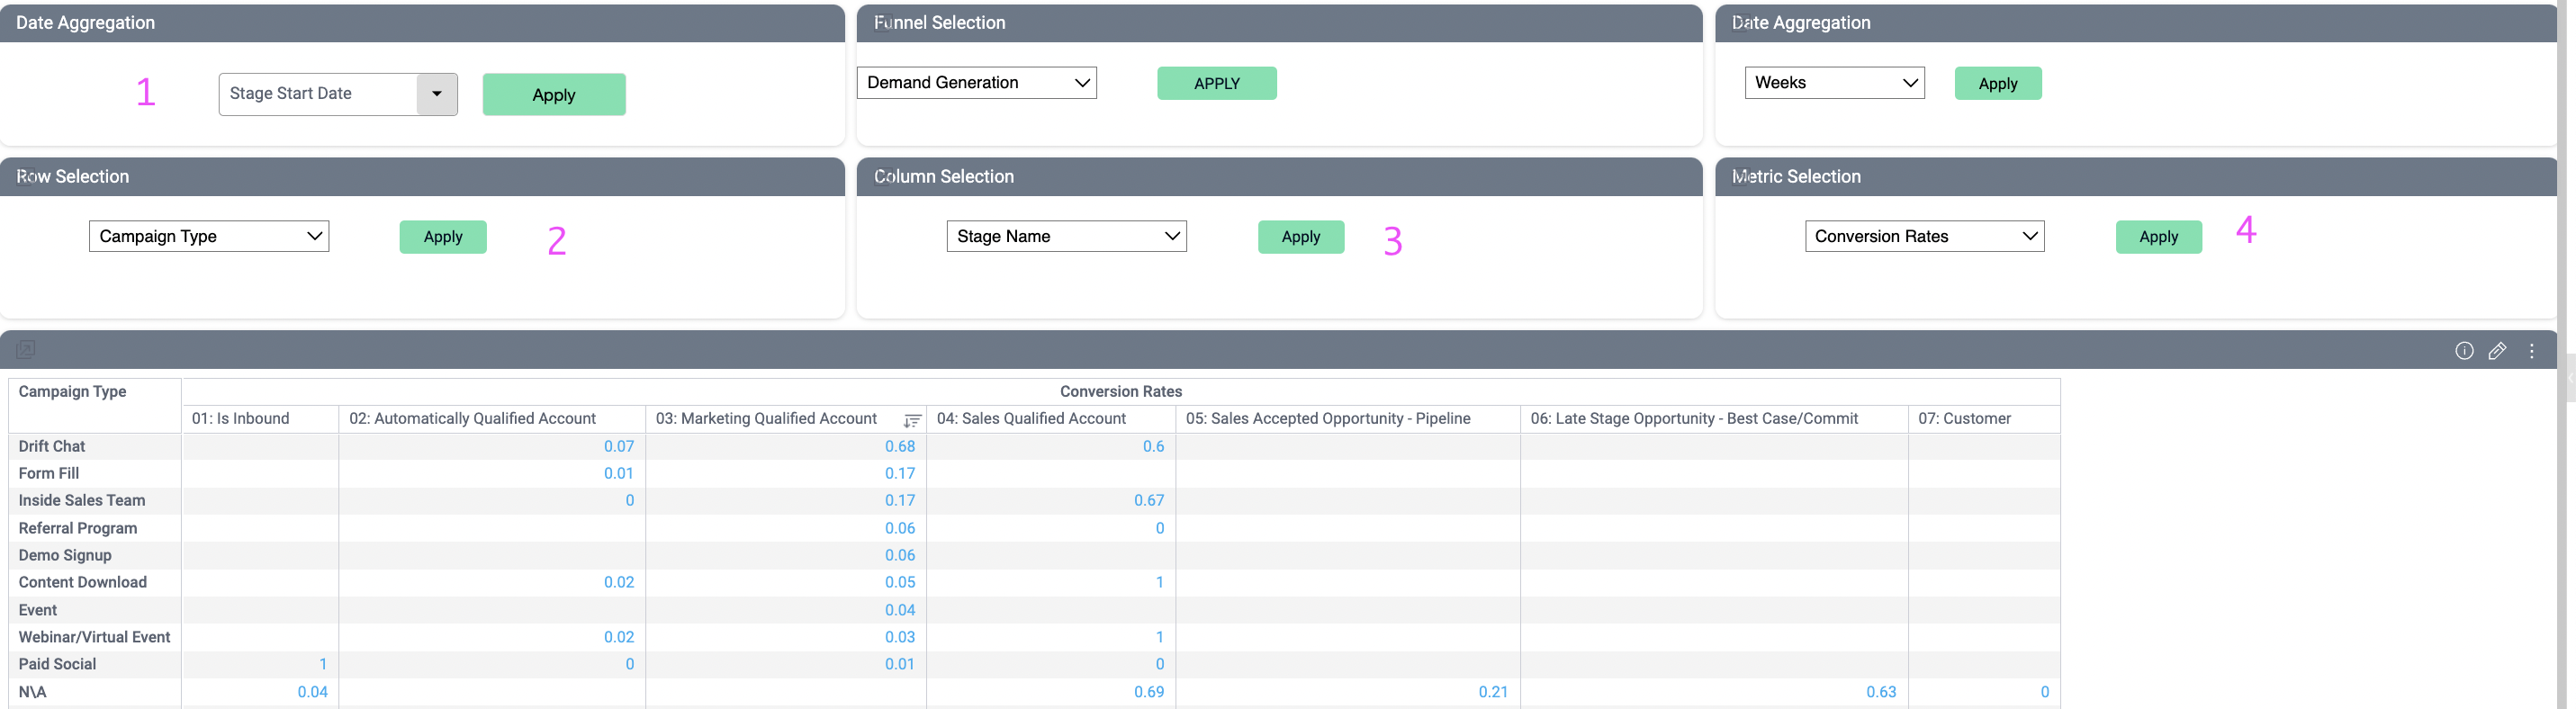
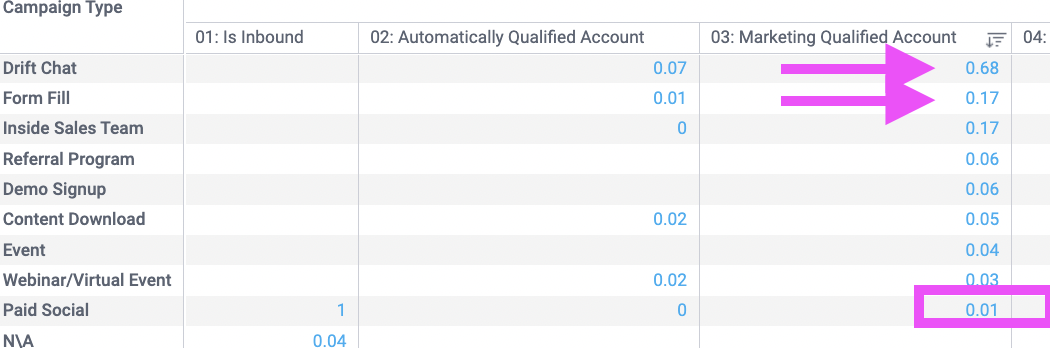
In this analysis, I can see that my lowest converting sources are Paid Social and. My highest converting source is Drift, followed by Form Fill.
Now let’s specifically look at the lead volume in March by changing our Metric Selection (1) to Journeys and our date range (2), our lowest converting month:
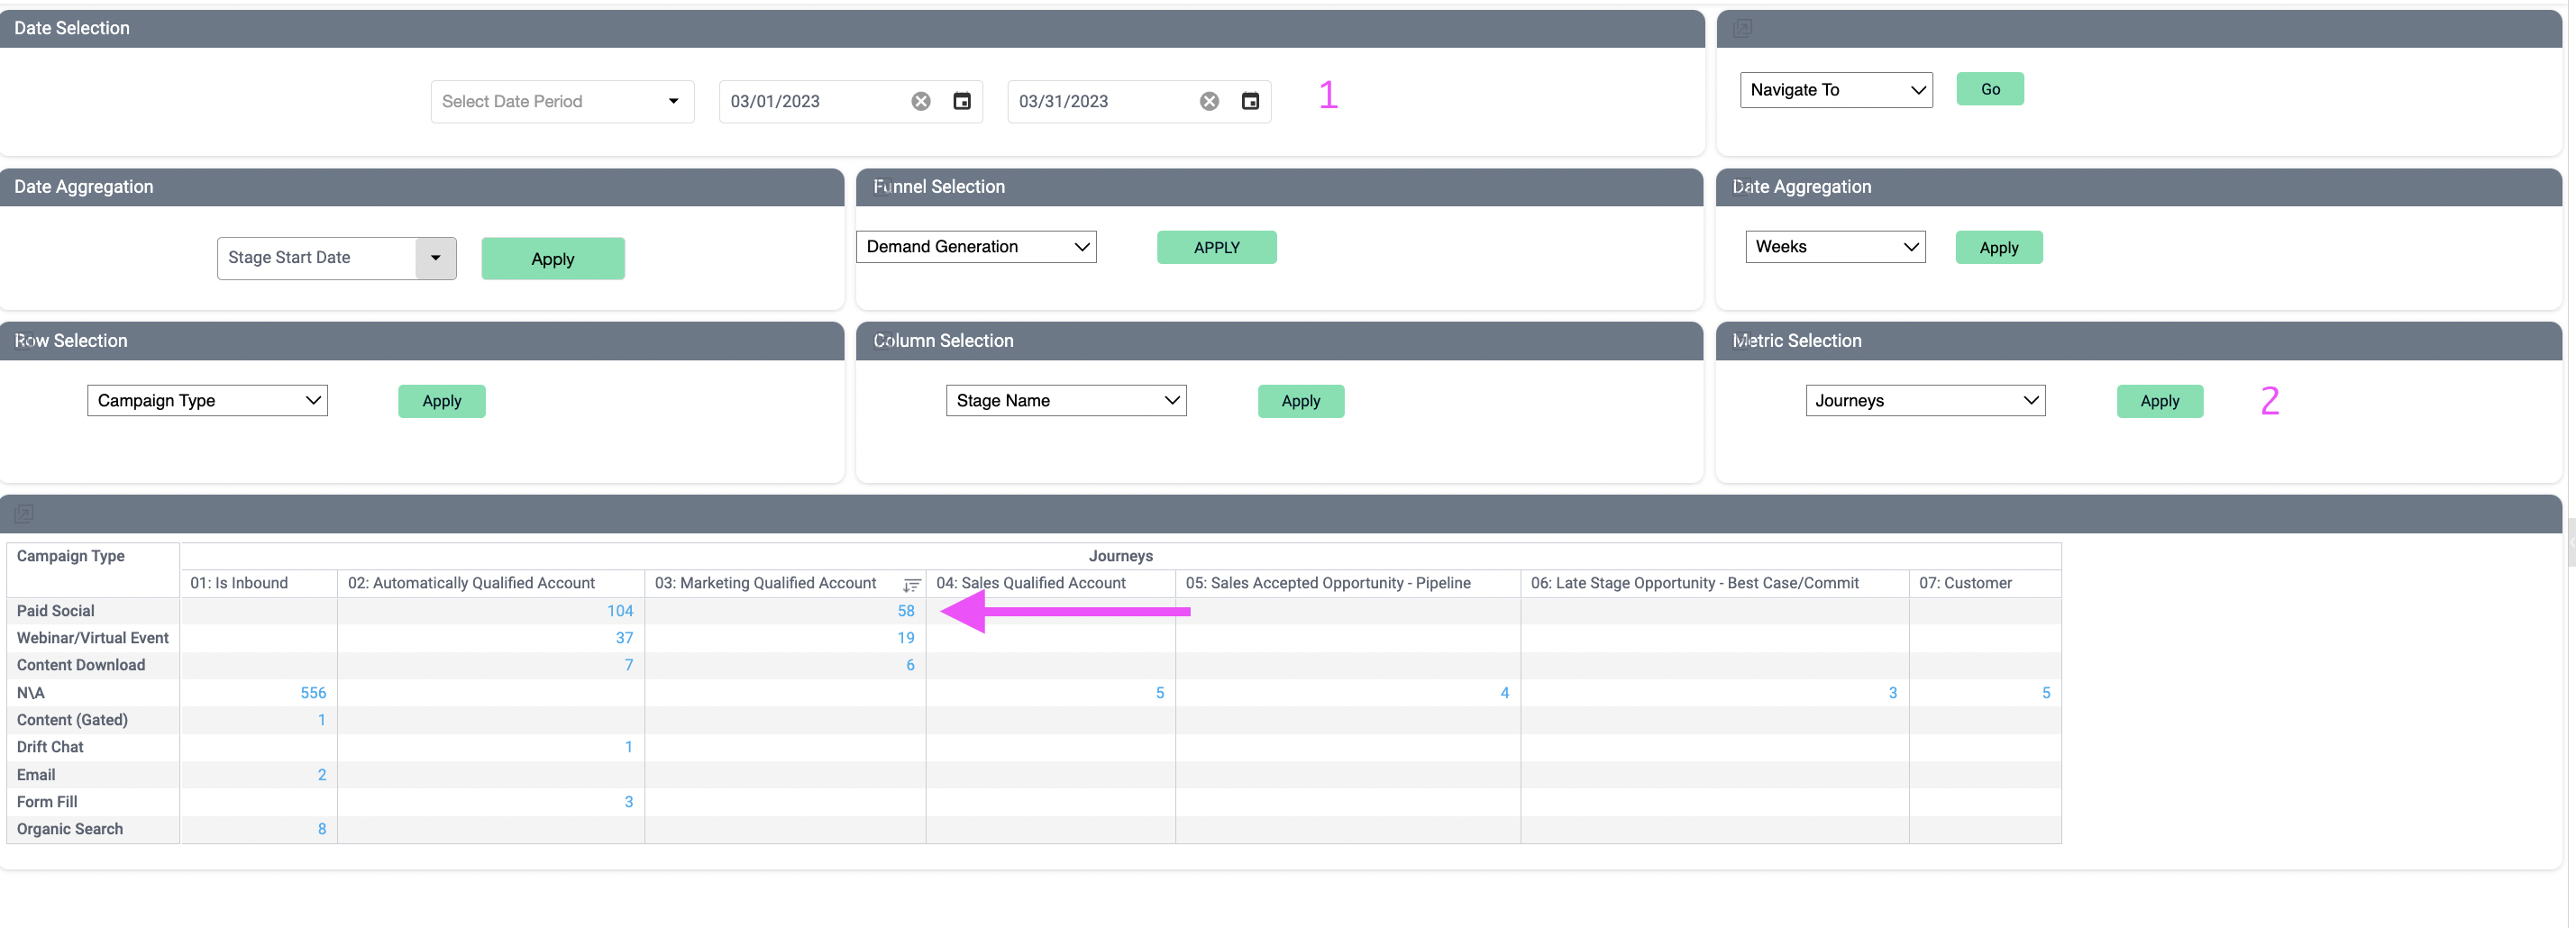
Using our conversion data, we now have a solid theory for why that month underperformed. Our marketing mix was almost exclusively focused on our lowest converting tactic (Paid Social).
The same analysis can be done for each subsequent stage in the funnel. In later stages, you’ll want your sales leadership team to investigate the following:
- Whether the sales team is performing better when they target specific industries or personas versus others
- If certain salespeople are better at managing different parts of the sales cycle, and whether that knowledge can be shared across the team to improve other salespeople’s performance
- If sales leadership is appropriately managing their pipeline or if they are more focused on closing business
Video: How to use CaliberMind to see which salespeople are the best at managing different stages.
How can I use CaliberMind to flag engaged accounts to sales and shorten my sales cycle?
CaliberMind’s engagement product leverages a combination of first- and third-party signals to score how engaged or active a prospect is with your brand. Many customers leverage us in addition to 6sense or other intent providers because your sales team can use CaliberMind to see exactly which assets and web content their account is engaged with, allowing them to better refine their prospecting attempts to what the prospect is most interested in.
Check out NetApp’s use of engagement Trending Emails to engage their sales team and realize a massive uplift in target account opportunities here.
Video: Using Engagement Emails to Alert Sales
Link to Surge Scoring Email help documentation.
Link to how to display engagement data in Salesforce.
How to use CaliberMind Attribution data to shorten the sales cycle
Attribution data is not separated into granular chunks by opportunity stage. Rather, we think about pipeline generation and what is closed. We also divide attribution by the dollars associated with touchpoints before opportunity creation, and those associated with touchpoints between opportunity create and close.
When we use pipeline-generated reports to optimize campaign performance, we move the priority from a volume or lead-based focus to a pipeline health focus.
- If we look at pipeline-generated attribution and focus on optimizing the campaigns that are more effective pre-opportunity, we are focused on generating more net new opportunities and pipeline.
- If we look at pipeline-generated attribution and focus on optimizing the campaigns that are more effective post-opportunity, we are focused on keeping in-flight deals engaged.
When we use booked attribution reports to optimize campaign performance, we are moving the priority away from a pipeline volume goal to refining our approach for customer acquisition or specifically what is most likely to generate a customer.
- If we look at bookings attribution and focus on optimizing the campaigns that are more effective pre-opportunity, we are focused on generating more net new bookings.
- If we look at bookings attribution and focus on optimizing the campaigns that are more effective post-opportunity, we are focused on helping sales close more in-flight deals.
Video: How to use CaliberMind to create more pipeline
How to use CaliberMind Attribution reports to generate more pipeline
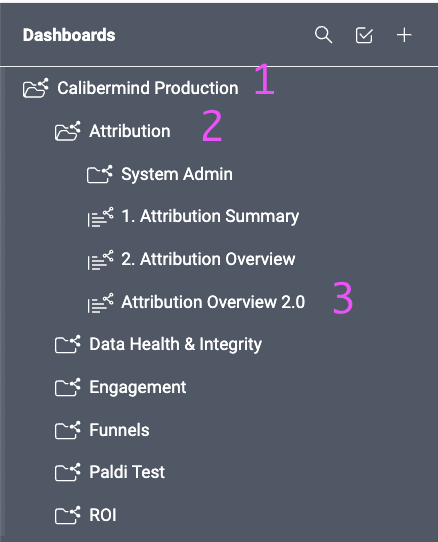
- Go to Insights, expand your Dashboard Template folder (1), expand the Attribution folder (2), and open the Attribution 2.0 dashboard.
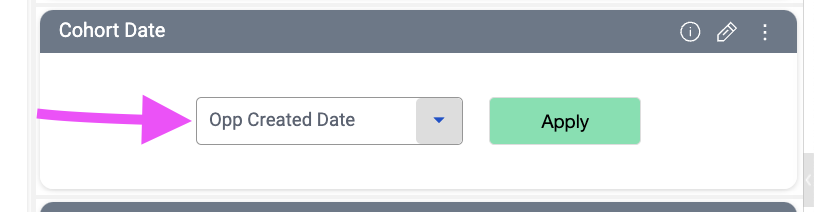
- Set the Cohort Date to the Opp Created Date then click the green Apply button:
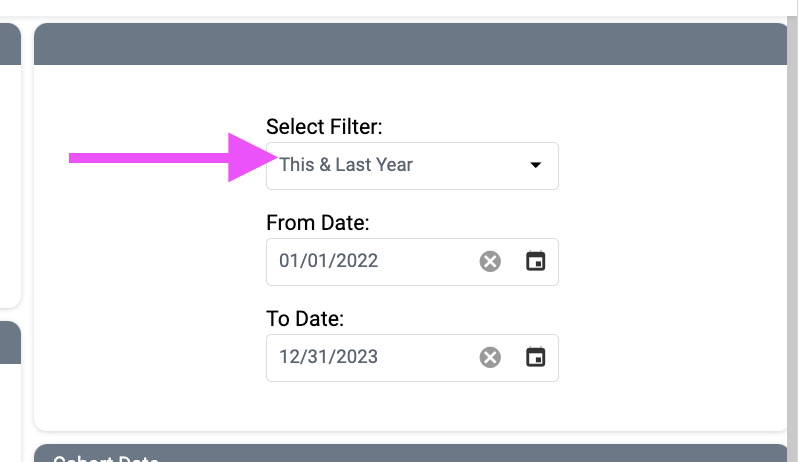
- Adjust the date range to look at This & Last Year:
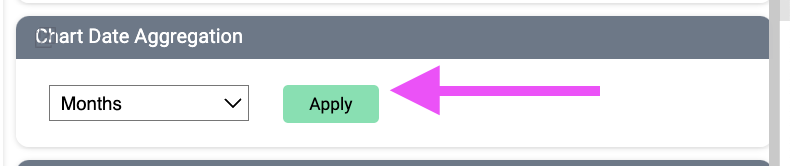
- Set the Chart Date Aggregation to Months then click the green Apply button:
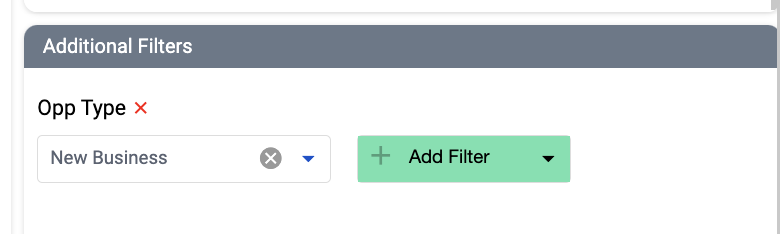
- In this example, we’ll look at net new business by adding a filter under Additional Filters for Opportunity Type equals New Business:
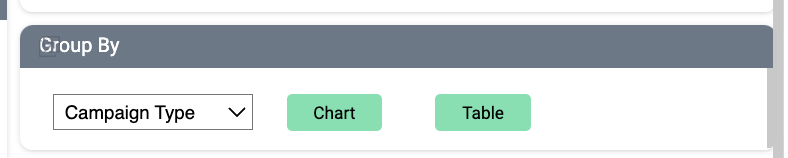
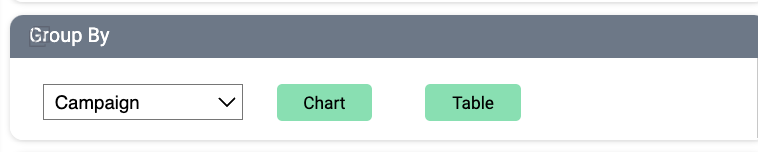
- Change the Chart and Table Group By setting to Campaign Type.
In my data, I notice some potential for webinars and events to generate more pipeline. I’m going to add an additional filter and evaluate the individual campaigns.
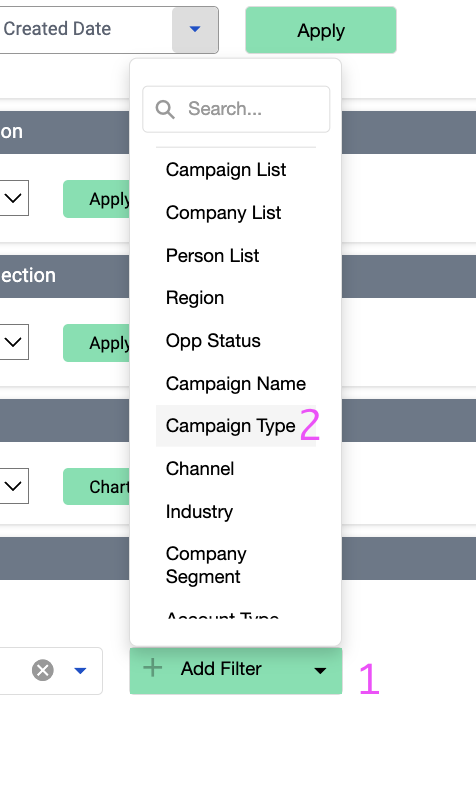
- Click Add Filter (1) under Additional Filters and select Campaign Type (2):
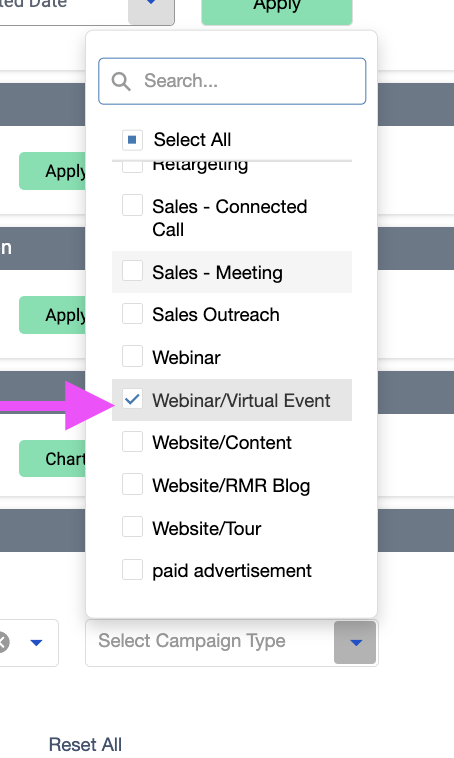
- Select your Event and Webinar categories by clicking on the newly added Campaign Type filter:
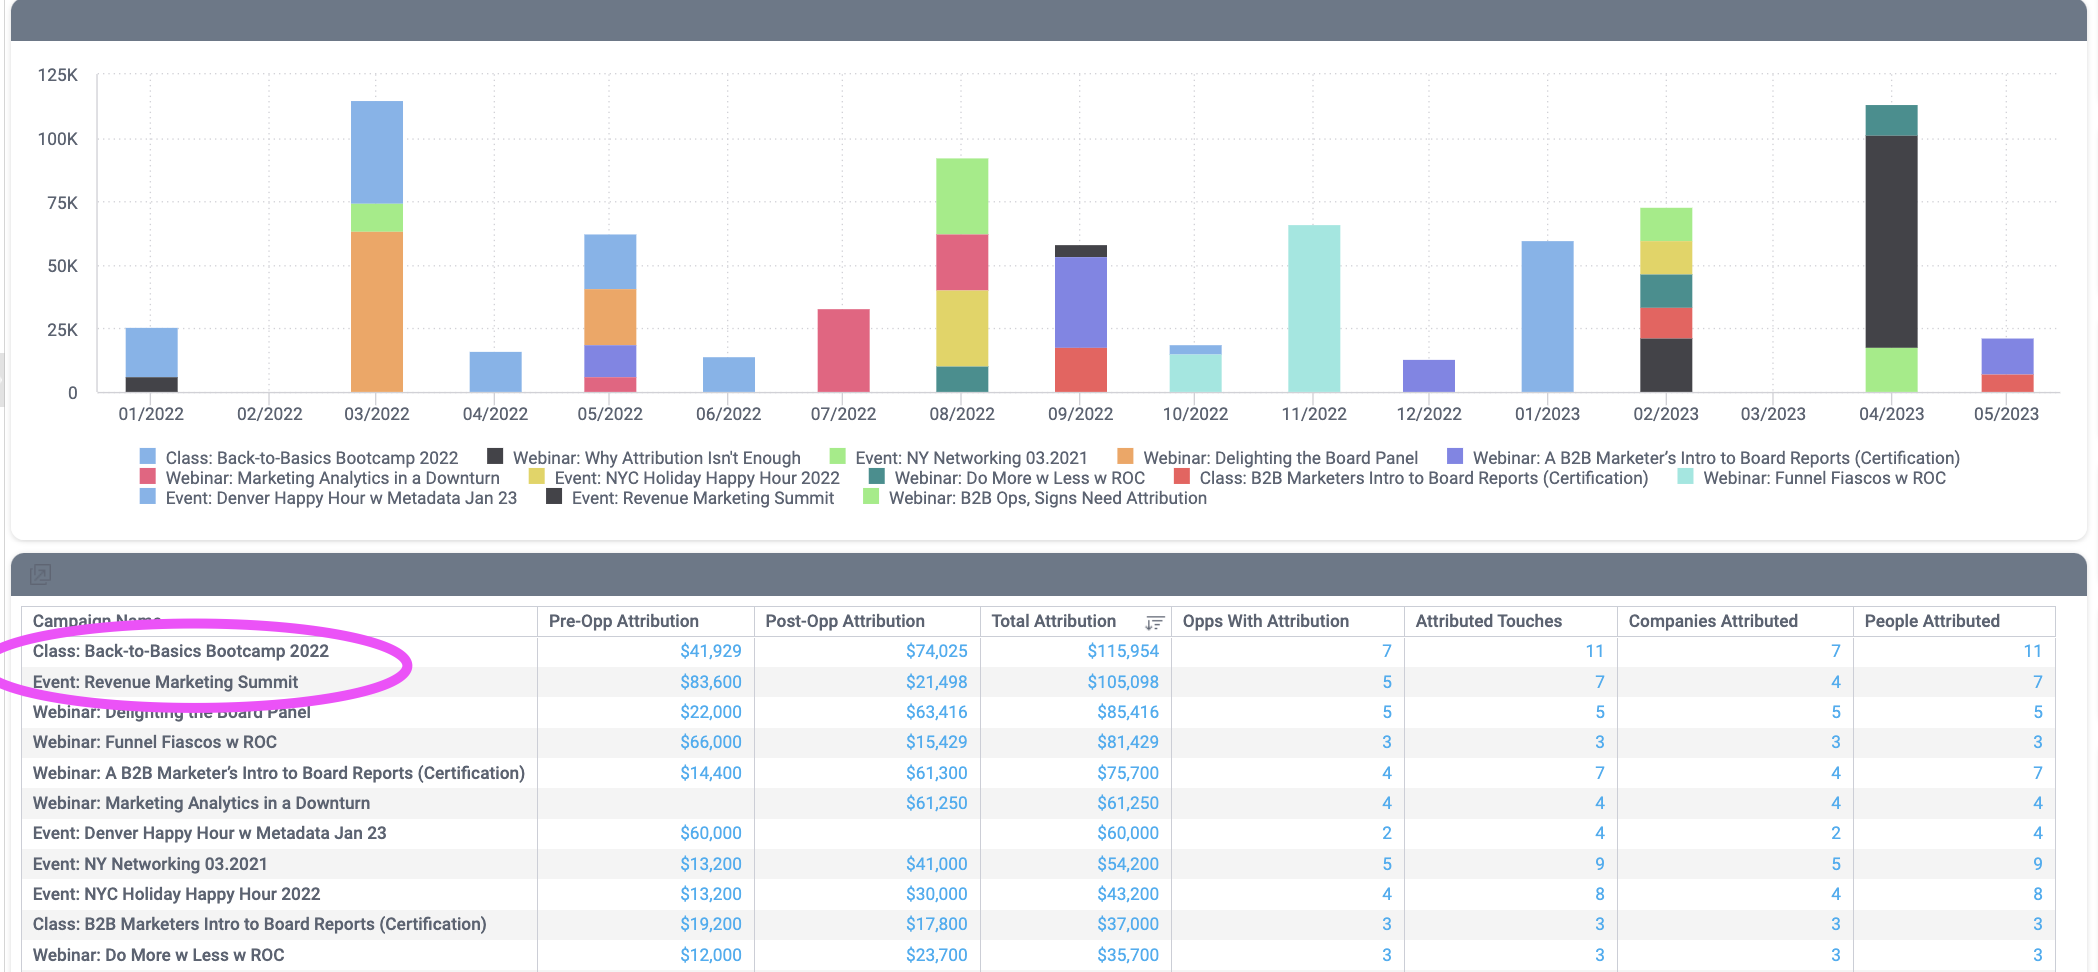
- Change the Group By setting for Chart and Table to be Campaign:
I see a few campaigns are better at account acquisition versus others that are better at engaging in-flight opportunities. If my sales team is primarily focused on trying to generate more pipeline, I will try to replicate the success we had with our bootcamp and Revenue Marketing Summit event:
Video: How to use CaliberMind to create more bookings
How to use CaliberMind Attribution reports to generate more bookings
- Go to Insights, expand your Dashboard Template folder (1), expand the Attribution folder (2), and open the Attribution 2.0 dashboard.
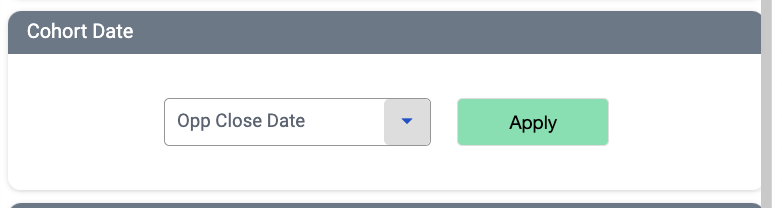
- Set the Cohort Date to the Opp Closed Date, then click the green Apply button:
- Adjust the date range to look at This & Last Year:
- Set the Chart Date Aggregation to Months, then click the green Apply button:
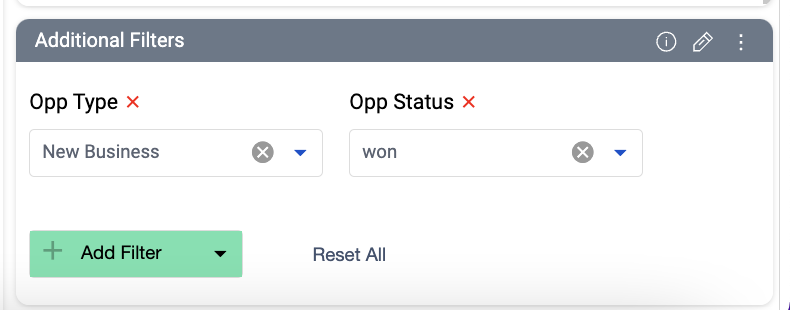
- In this example, we’ll look at net new business by adding a filter for Opp Type equals New Business. We’ll also add a filter for Opp Status equals won.
- Change the Chart and Table Group By setting to Campaign Type:
In my data, I notice some potential for Webinar / Virtual Event to generate more bookings. I’m going to add an additional filter and evaluate the individual campaigns.
- Click Add Filter (1) under Additional Filters and select Campaign Type (2):
- Select your Event and Webinar categories by clicking on the newly added Campaign Type filter:
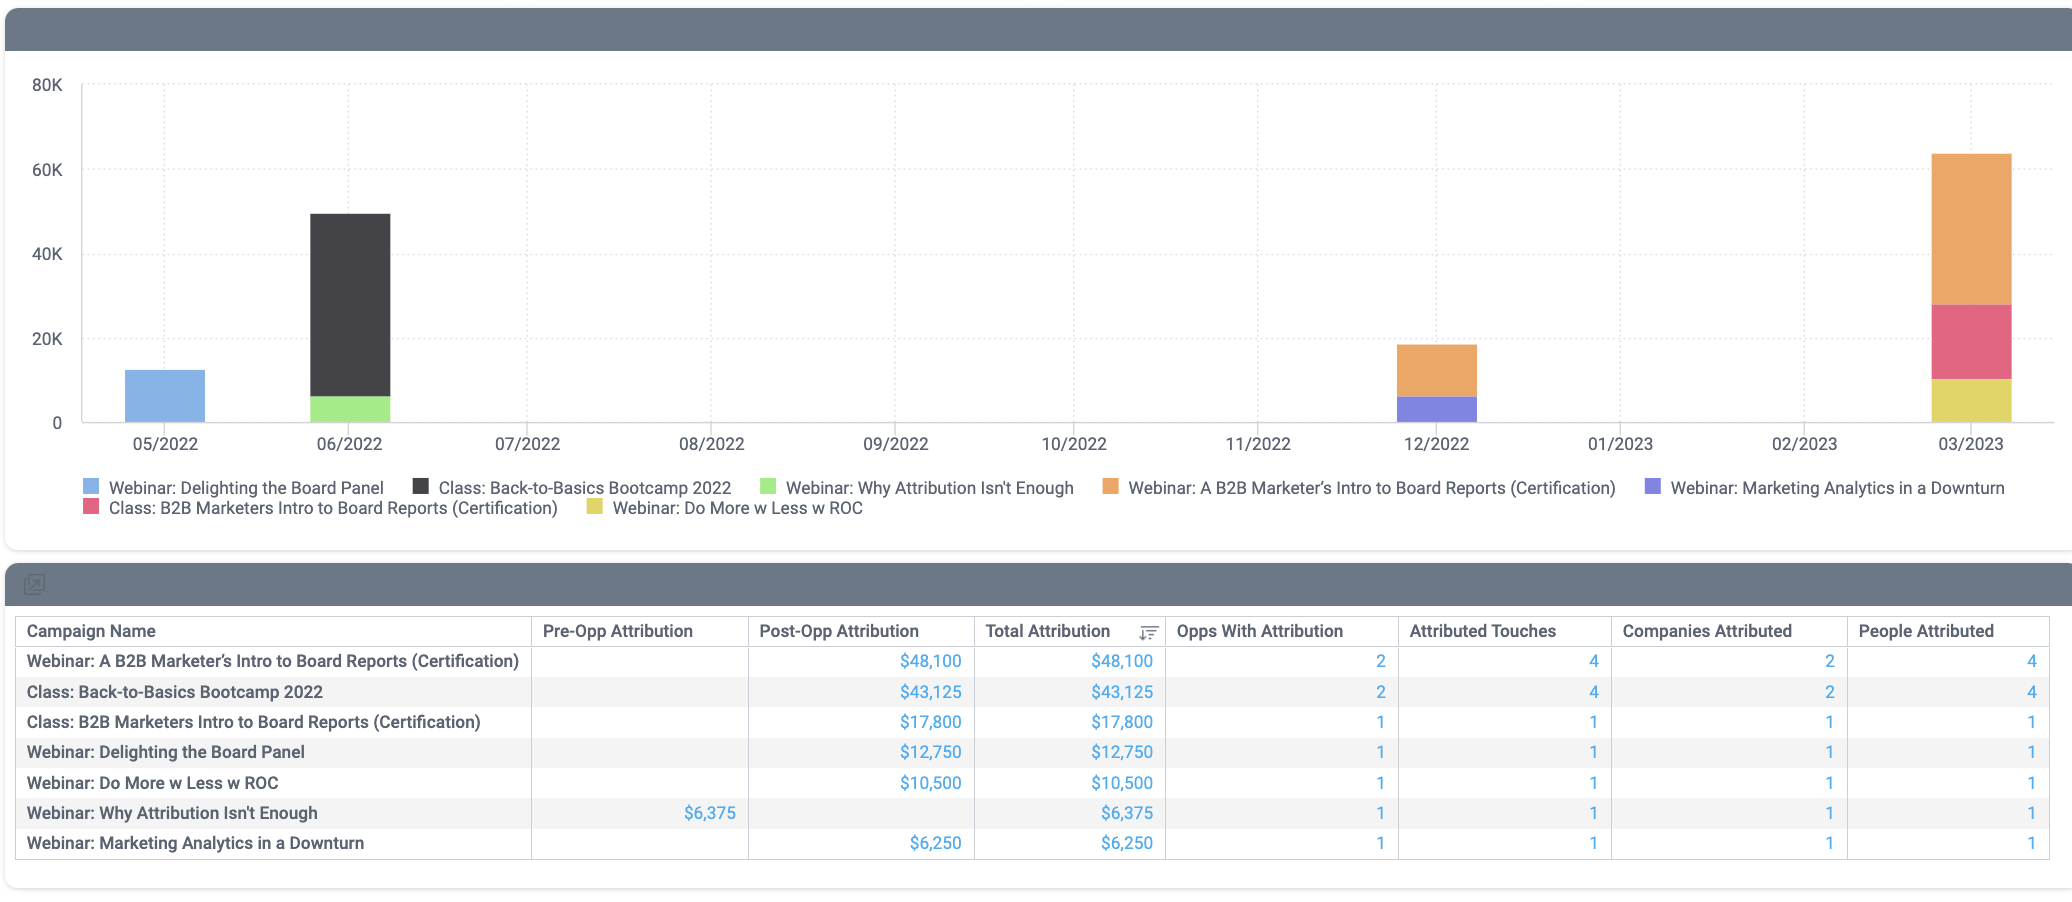
- Change the Group By setting for Chart and Table to be Campaign:
I see a few campaigns are better at account acquisition (higher Pre-Opp Attribution) versus others that are better at engaging in-flight opportunities (higher Post-Opp Attribution). If my sales team is primarily focused on trying to generate more pipeline, I will try to replicate the success we had with our Board Certification program.
Other CaliberMind Tools to shorten sales cycles
Here are some creative ways to use CaliberMind reports to shorten the sales cycle:
- Use the Attribution by Persona dashboard to see whether you’ve optimized your website content for the profiles most likely to hit your page first
- Use the Attribution by Persona dashboard to see whether you’ve tailored your content to attract and retain the attention of the key personas interacting with your brand
- Use Attribution 2.0 and group the chart and table by Industry to see if there are industry personalizations you can introduce to your website for the top industries
- Hold regular meetings with your sales team to review top engaged accounts and pipeline generation to open up a feedback loop with your sales team
- Use the Funnel Trend Analysis dashboard to see which stages take the longest and work with revenue operations to figure out how to shorten sales cycles by either optimizing your CRM setup or creating content to support sales enablement.